Question: please solve completely satis considered to be incontro sing the . 3 14 10 2 10 11 Samples 6 10 11 TO 7 12 12

please solve completely please solve completely satis considered to be
please solve completely satis considered to be
satis considered to be incontro sing the . 3 14 10 2 10 11 Samples 6 10 11 TO 7 12 12 10 1 11 10 11 7 13 18 1 19 2 10 10 19 10 11 10 11 13 TO TE a) Stridord sowation of the storing moans une round your response to the crew b) With 23 the control for the man chartre UCL - Lounceni pround your uponse to three decat ce L.C. cunces pour your response to the decimal places c) The controllimits for the R-chart UCLA once round your response to the comes LCR ounces fround your response to v decepce d) Based on the x chart is one or more samles beyond the control Based on the R.chart is one or more samples beyond the controllimis? DUALS. Below are the last 10 samples (each of size = 5) taken the population process standard deviation is 120 Definition - X Sample Size, ounces (round your respo are Mean Factor A2 1.880 1.023 0.729 0577 0.483 0419 0.373 0.337 0.308 0266 2 3 4 5 6 7 8 9 10 12 Upper Range D 3268 2574 2282 2.115 2004 1.924 1 854 1816 1777 1716 Lower Range D 0 0 0 0 0 0076 0.136 0.184 032 Insert Eaton to three decimal places) to three decimal places to three decimal places) to three decimal places) Print Done beyond the controllimits? yond the control limits satis considered to be incontro sing the . 3 14 10 2 10 11 Samples 6 10 11 TO 7 12 12 10 1 11 10 11 7 13 18 1 19 2 10 10 19 10 11 10 11 13 TO TE a) Stridord sowation of the storing moans une round your response to the crew b) With 23 the control for the man chartre UCL - Lounceni pround your uponse to three decat ce L.C. cunces pour your response to the decimal places c) The controllimits for the R-chart UCLA once round your response to the comes LCR ounces fround your response to v decepce d) Based on the x chart is one or more samles beyond the control Based on the R.chart is one or more samples beyond the controllimis? DUALS. Below are the last 10 samples (each of size = 5) taken the population process standard deviation is 120 Definition - X Sample Size, ounces (round your respo are Mean Factor A2 1.880 1.023 0.729 0577 0.483 0419 0.373 0.337 0.308 0266 2 3 4 5 6 7 8 9 10 12 Upper Range D 3268 2574 2282 2.115 2004 1.924 1 854 1816 1777 1716 Lower Range D 0 0 0 0 0 0076 0.136 0.184 032 Insert Eaton to three decimal places) to three decimal places to three decimal places) to three decimal places) Print Done beyond the controllimits? yond the control limits

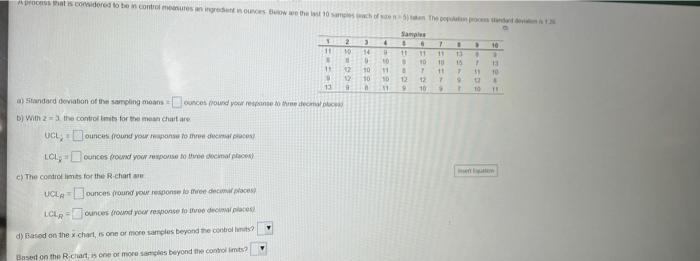
Step by Step Solution

There are 3 Steps involved in it

1 Expert Approved Answer
Step: 1 Unlock blur-text-image
Question Has Been Solved by an Expert!

Get step-by-step solutions from verified subject matter experts

Step: 2 Unlock
Step: 3 Unlock

Students Have Also Explored These Related General Management Questions!