

Question: Please solve correctly using excel & pay attention to the sig figs There is a Canvas AUDIO tutorial available for this problem. This question requires
 Please solve correctly using excel & pay attention to the sig figs
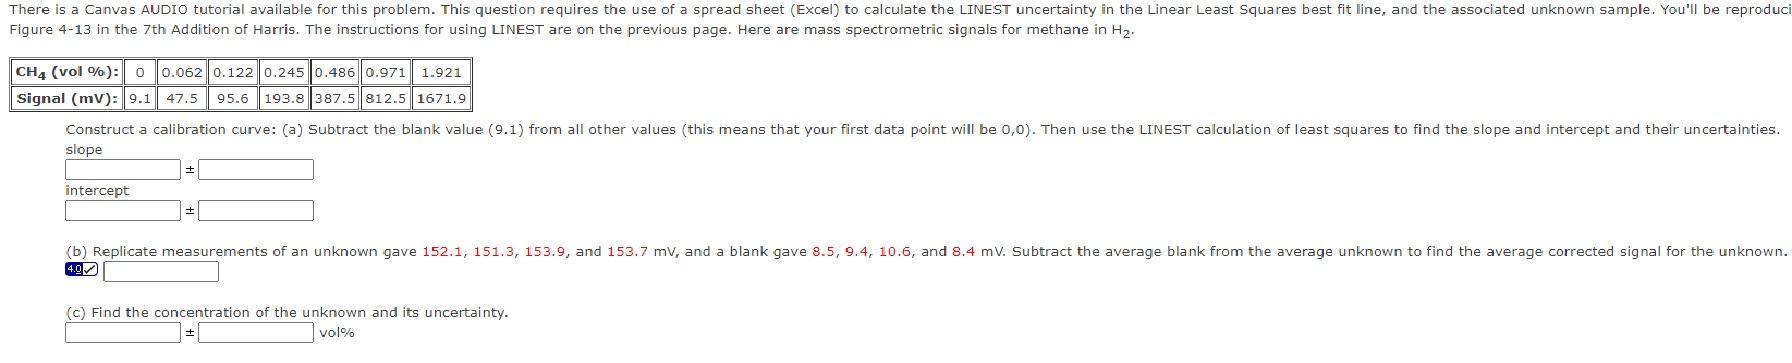
There is a Canvas AUDIO tutorial available for this problem. This question requires the use of a spread sheet (Excel) to calculate the LINEST uncertainty in the Linear Least Squares best fit line, and the associated unknown sample. You'll be reproduci Figure 4-13 in the 7th Addition of Harris. The instructions for using LINEST are on the previous page. Here are mass spectrometric signals for methane in Hz. CH4 (vol %): 0 0.062 0.122 0.245 0.4860.971 1.921 Signal (mv): 9.1 47.595.6 193.8 387.5 812.5 1671.9 Construct a calibration curve: (a) Subtract the blank value (9.1) from all other values (this means that your first data point will be 0,0). Then use the LINEST calculation of least squares to find the slope and intercept and their uncertainties. slope + intercept + (b) Replicate measurements of an unknown gave 152.1, 151.3, 153.9, and 153.7 mv, and a blank gave 8.5, 9.4, 10.6, and 8.4 mv. Subtract the average blank from the average unknown to find the average corrected signal for the unknown. (c) Find the concentration of the unknown and its uncertainty. vol%
Step by Step Solution
There are 3 Steps involved in it
Problem ID 18326536 Mass Spectrometric Calibration via LINEST in Excel Given Data Calibration Data C... View full answer

Get step-by-step solutions from verified subject matter experts