

Question: Please solve for A, B, and C. Please show your work, including formula used and how you got your answer. Performance in Forecasting Quarterly Earnings
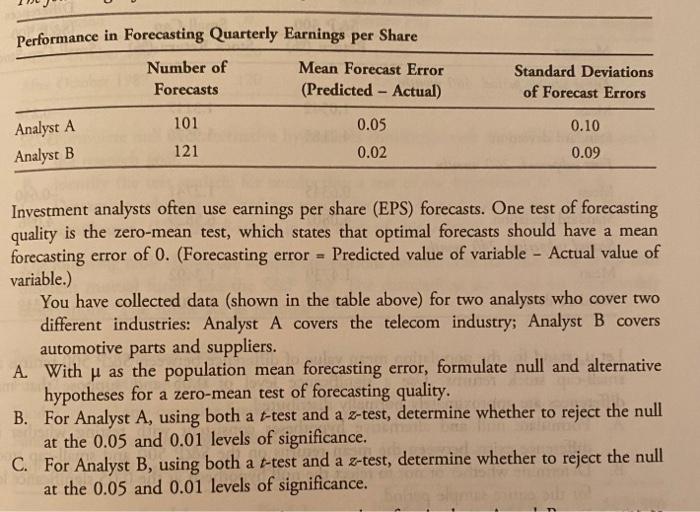
Performance in Forecasting Quarterly Earnings per Share Number of Mean Forecast Error Forecasts (Predicted - Actual) Standard Deviations of Forecast Errors 101 0.10 Analyst A Analyst B 0.05 0.02 121 0.09 Investment analysts often use earnings per share (EPS) forecasts. One test of forecasting quality is the zero- mean test, which states that optimal forecasts should have a mean forecasting error of 0. (Forecasting error = Predicted value of variable - Actual value of variable.) You have collected data (shown in the table above) for two analysts who cover two different industries: Analyst A covers the telecom industry; Analyst B covers automotive parts and suppliers. A With p as the population mean forecasting error, formulate null and alternative hypotheses for a zero-mean test of forecasting quality. B. For Analyst A, using both a t-test and a 2-test, determine whether to reject the null at the 0.05 and 0.01 levels of significance. C. For Analyst B, using both a t-test and a Z-test, determine whether to reject the null at the 0.05 and 0.01 levels of significance
Step by Step Solution
There are 3 Steps involved in it

Get step-by-step solutions from verified subject matter experts