

Question: Please solve for all the incorrect and missing parts below ( quickly) no need to explain too much. 0. Remove the outliers (if any) from
Please solve for all the incorrect and missing parts below ( quickly) no need to explain too much.
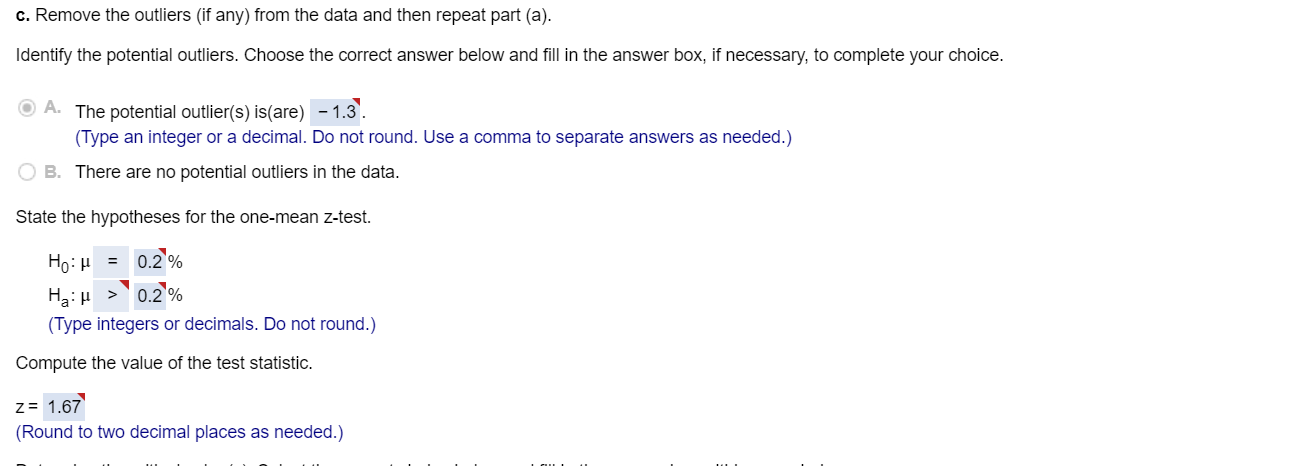
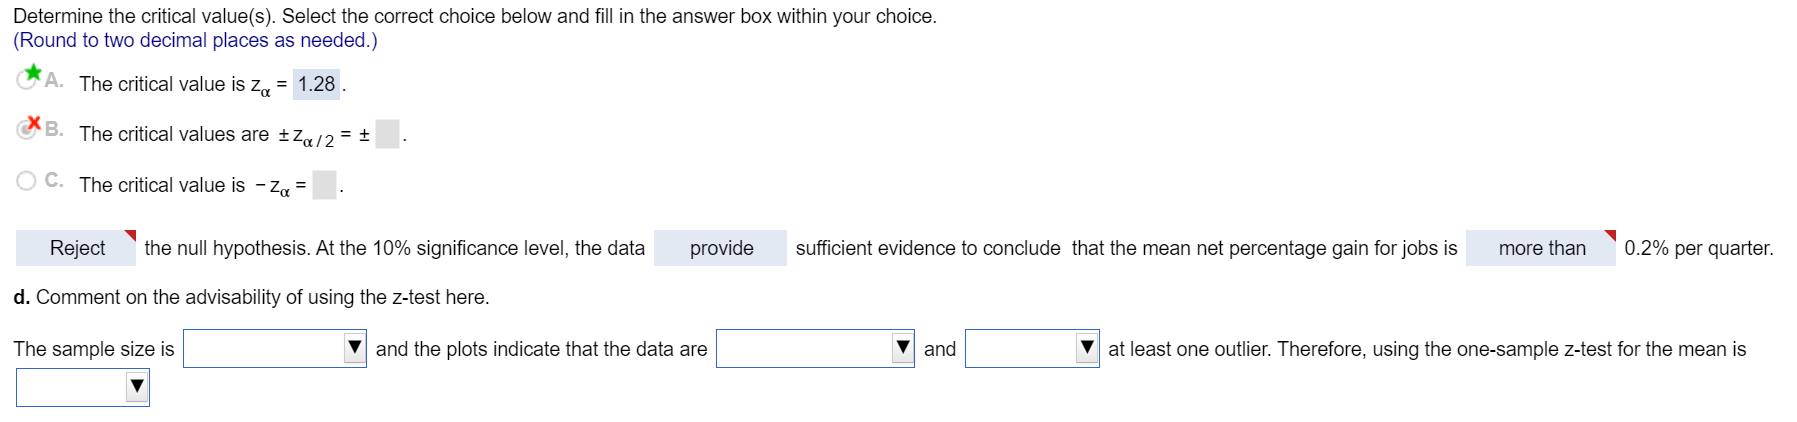
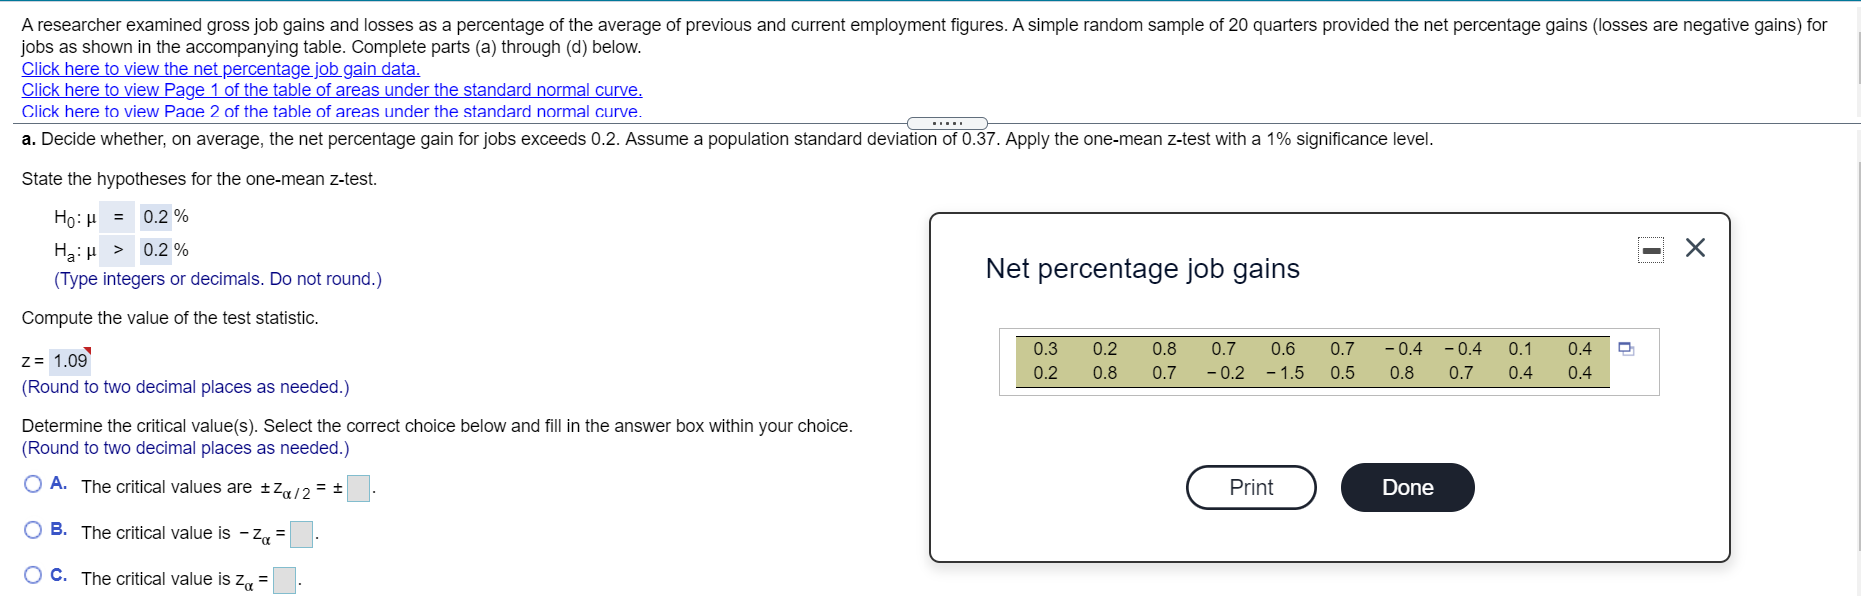
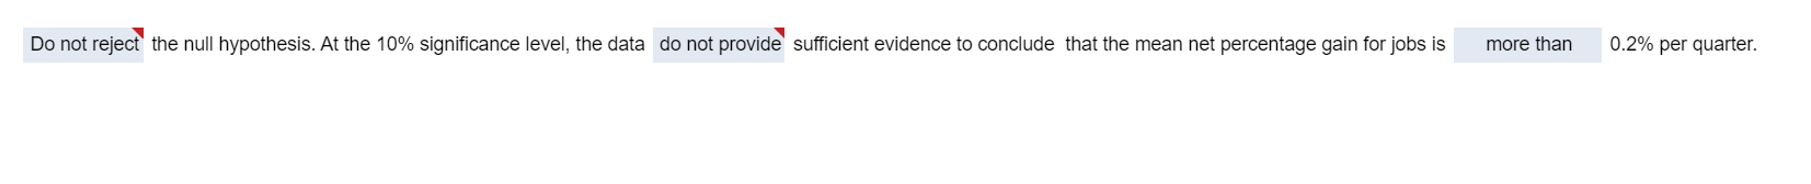
0. Remove the outliers (if any) from the data and then repeat part (a). Identify the potential outliers. Choose the correct answer below and ll in the answer box, if necessary, to complete your choice. ' A- The potential outlier(s) is(are) 1.3'. (Type an integer or a decimal. Do not round. Use a comma to separate answers as needed.) B. There are no potential outliers in the data. State the hypotheses for the one-mean z-test. H0: [1 = 0.5% Ha: p >' 0.5% (Type integers or decimals. Do not round.) Compute the value of the test statistic. Z: 1.67' {Round to two decimal places as needed.) Deteimine the critical value(s). Select the correct choice below and ll in the answer box within your choice. (Round to two decimal places as needed.) *A- The critical value is z\" = 1.28 . 'u 5- The critical values are $2.,\" = 1 C- The critical value is -zI = Reject ' the null hypothesis. At the 10% signicance level, the data provide sufcient evidence to conclude that the mean net percentage gain for jobs is more than ' 0.2% per quarter. d. Comment on the advisability of using the ztest here. The sample size is l and the plots indicate that the data are l and l at least one outlier. Therefore, using the onesample ztest for the mean is V A researcher examined gross iob gains and losses as a percentage of the average of previous and current employment gures. A simple random sample of 20 quarters provided the net percentage gains (losses are negative gains) for ions as shown in the accompanying table. Complete pans (a) through (d) below. Click here to view the net percentage j gain data. Click here to view Page 1 of the table of areas under the standard normal curve. Click here to View Page 2 of the table of areas under the standard normal curve. 3. Decide whether, on average, the net percentage gain for jobs exceeds 0.2. Assume a population standard deviation of 0.37. Apply the one-mean z-test with a 1% signicance level. State the hypotheses for the one-mean ztest. H0: [1 = 0.2 % Ha: p > 0.2 "In . . (Type integers or decimals. Do not round.) NEt percentage JOb gains Compute the value of the test statistic. z = 1.09' (Round to two decimal places as needed.) Determine the critical value(5). Select the correct choice below and ll in the answer box within your choice. (Round to two decimal places as needed.) O A- The critical values are HR\" = : O 5- The critical value is '10:: O c- The critical value is z\" =
Step by Step Solution
There are 3 Steps involved in it

Get step-by-step solutions from verified subject matter experts