

Question: Please solve for B Presented below is the comparative balance sheet for Tamarisk Company. Tamarisk Company Comparative Balance Sheet As of December 31, 2021 and
Please solve for B
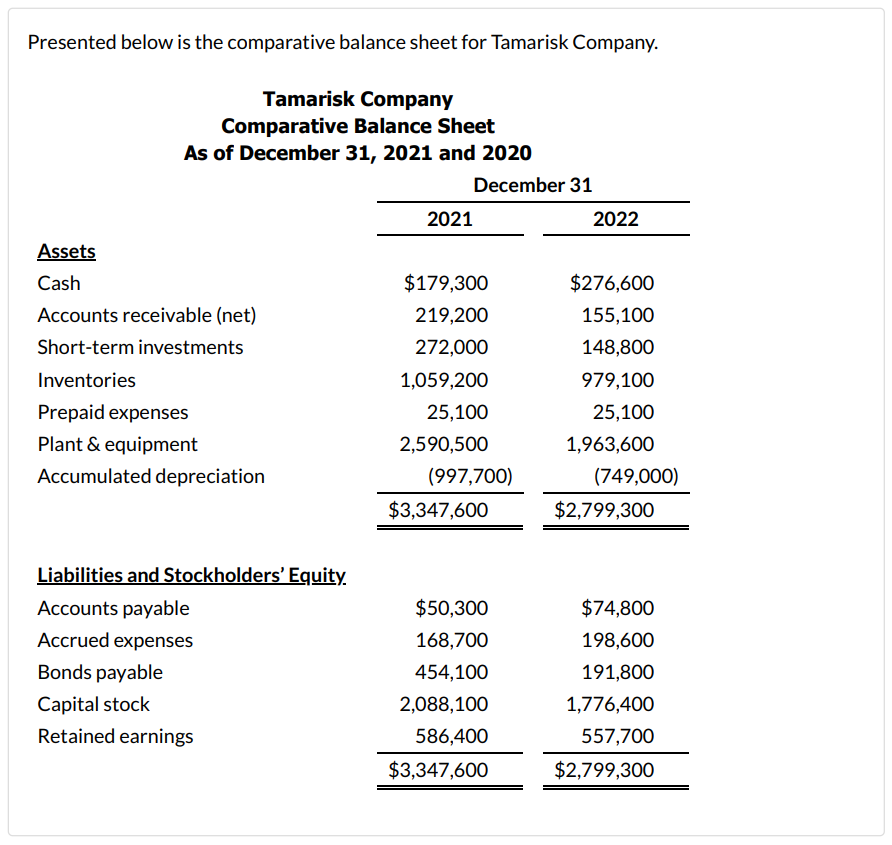
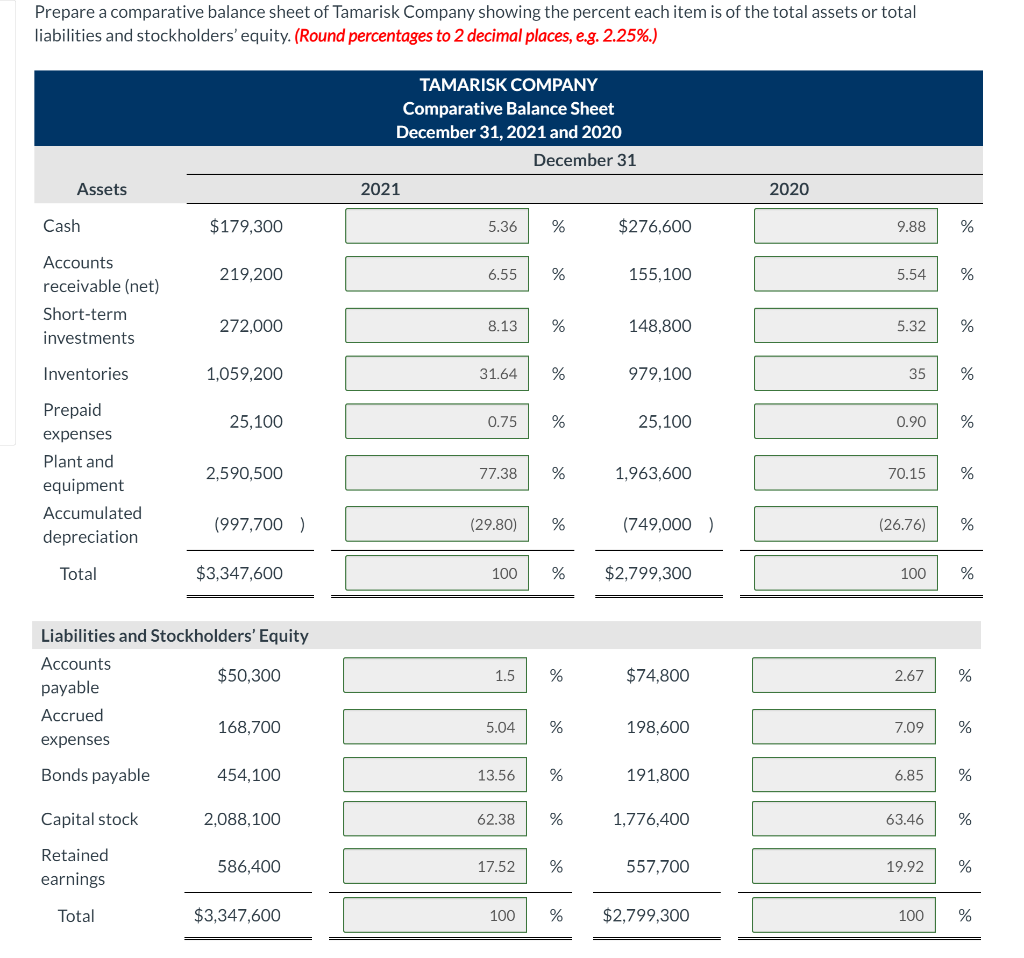
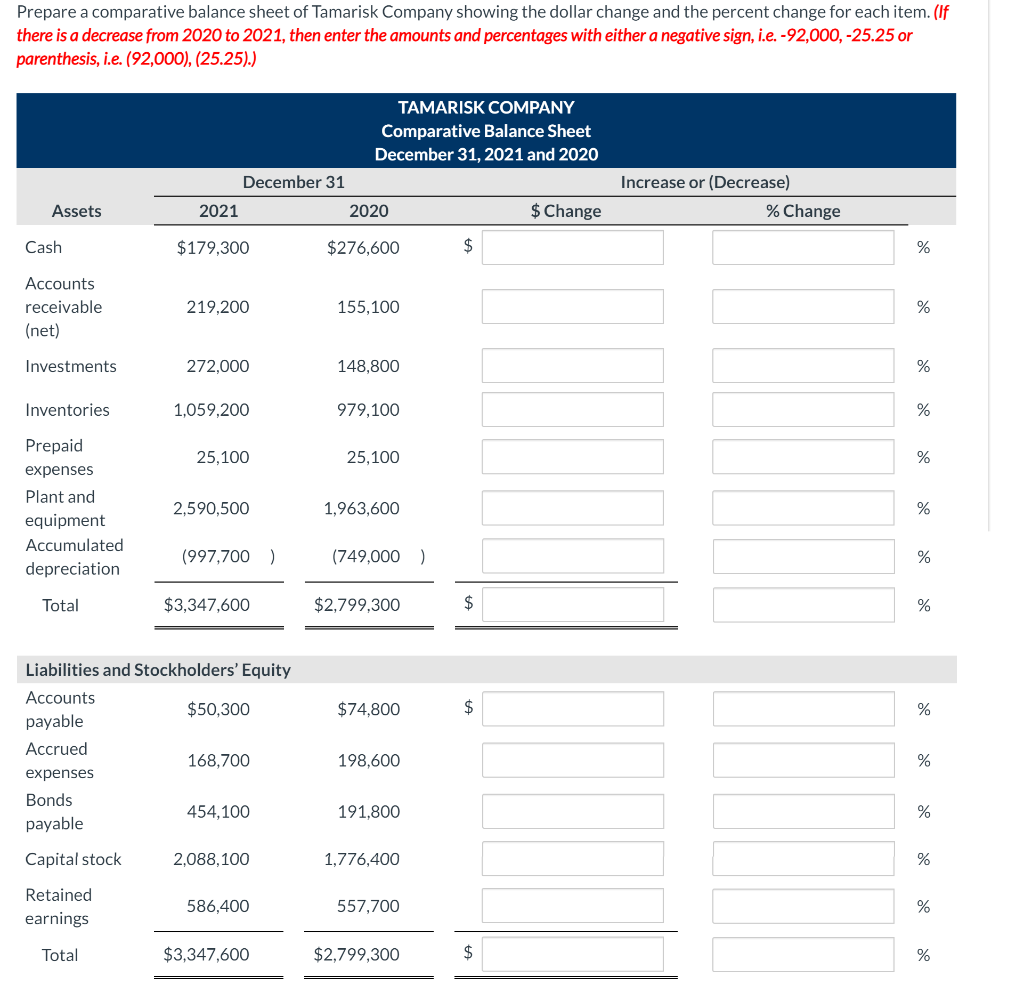
Presented below is the comparative balance sheet for Tamarisk Company. Tamarisk Company Comparative Balance Sheet As of December 31, 2021 and 2020 December 31 2021 2022 Assets Cash $179,300 $276,600 Accounts receivable (net) 219,200 155,100 Short-term investments 272,000 148,800 Inventories 1,059,200 979,100 Prepaid expenses 25,100 25,100 Plant & equipment 2,590,500 1,963,600 Accumulated depreciation (997,700) (749,000) $3,347,600 $2,799,300 $74,800 198,600 Liabilities and Stockholders' Equity. Accounts payable Accrued expenses Bonds payable Capital stock Retained earnings $50,300 168,700 454,100 2,088,100 586,400 $3,347,600 191,800 1,776,400 557,700 $2,799,300 Prepare a comparative balance sheet of Tamarisk Company showing the percent each item is of the total assets or total liabilities and stockholders' equity. (Round percentages to 2 decimal places, e.g. 2.25%.) TAMARISK COMPANY Comparative Balance Sheet December 31, 2021 and 2020 December 31 2021 Assets 2020 Cash $179,300 5.36 % $276,600 9.88 % 219,200 6.55 % 155,100 5.54 % Accounts receivable (net) Short-term investments 272,000 8.13 % 148,800 5.32 % Inventories 1,059,200 31.64 % 979.100 35 % 25,100 0.75 % 25,100 0.90 % Prepaid expenses Plant and equipment Accumulated depreciation 2,590,500 77.38 % 1,963,600 70.15 % (997,700) (29.80) % (749,000) (26.76) % Total $3,347,600 100 % $2,799,300 100 % 1.5 % $74,800 2.67 % Liabilities and Stockholders' Equity Accounts $50,300 payable Accrued 168,700 expenses 5.04 % 198,600 7.09 % Bonds payable 454,100 13.56 % 191,800 6.85 % Capital stock 2,088,100 62.38 % 1,776,400 63.46 % Retained earnings 586,400 17.52 % 557,700 19.92 % Total $3,347,600 100 % $2,799,300 100 % Prepare a comparative balance sheet of Tamarisk Company showing the dollar change and the percent change for each item. (If there is a decrease from 2020 to 2021, then enter the amounts and percentages with either a negative sign, i.e.-92,000,-25.25 or parenthesis, i.e. (92,000), (25.25).) TAMARISK COMPANY Comparative Balance Sheet December 31, 2021 and 2020 December 31 Increase or (Decrease) % Change Assets 2021 2020 $ Change Cash $179,300 $276,600 $ % Accounts receivable (net) 219,200 155,100 % Investments 272,000 148,800 % Inventories 1,059,200 979,100 % 25,100 25,100 % Prepaid expenses Plant and equipment Accumulated depreciation 2,590,500 1,963,600 % (997,700) (749,000 ) % Total $3,347,600 $2,799,300 % $74,800 $ % Liabilities and Stockholders' Equity Accounts $50,300 payable Accrued 168,700 expenses Bonds 454,100 payable 198,600 % 191,800 % Capital stock 2,088,100 1,776,400 % Retained earnings 586,400 557,700 % Total $3,347,600 $2,799,300 % Presented below is the comparative balance sheet for Tamarisk Company. Tamarisk Company Comparative Balance Sheet As of December 31, 2021 and 2020 December 31 2021 2022 Assets Cash $179,300 $276,600 Accounts receivable (net) 219,200 155,100 Short-term investments 272,000 148,800 Inventories 1,059,200 979,100 Prepaid expenses 25,100 25,100 Plant & equipment 2,590,500 1,963,600 Accumulated depreciation (997,700) (749,000) $3,347,600 $2,799,300 $74,800 198,600 Liabilities and Stockholders' Equity. Accounts payable Accrued expenses Bonds payable Capital stock Retained earnings $50,300 168,700 454,100 2,088,100 586,400 $3,347,600 191,800 1,776,400 557,700 $2,799,300 Prepare a comparative balance sheet of Tamarisk Company showing the percent each item is of the total assets or total liabilities and stockholders' equity. (Round percentages to 2 decimal places, e.g. 2.25%.) TAMARISK COMPANY Comparative Balance Sheet December 31, 2021 and 2020 December 31 2021 Assets 2020 Cash $179,300 5.36 % $276,600 9.88 % 219,200 6.55 % 155,100 5.54 % Accounts receivable (net) Short-term investments 272,000 8.13 % 148,800 5.32 % Inventories 1,059,200 31.64 % 979.100 35 % 25,100 0.75 % 25,100 0.90 % Prepaid expenses Plant and equipment Accumulated depreciation 2,590,500 77.38 % 1,963,600 70.15 % (997,700) (29.80) % (749,000) (26.76) % Total $3,347,600 100 % $2,799,300 100 % 1.5 % $74,800 2.67 % Liabilities and Stockholders' Equity Accounts $50,300 payable Accrued 168,700 expenses 5.04 % 198,600 7.09 % Bonds payable 454,100 13.56 % 191,800 6.85 % Capital stock 2,088,100 62.38 % 1,776,400 63.46 % Retained earnings 586,400 17.52 % 557,700 19.92 % Total $3,347,600 100 % $2,799,300 100 % Prepare a comparative balance sheet of Tamarisk Company showing the dollar change and the percent change for each item. (If there is a decrease from 2020 to 2021, then enter the amounts and percentages with either a negative sign, i.e.-92,000,-25.25 or parenthesis, i.e. (92,000), (25.25).) TAMARISK COMPANY Comparative Balance Sheet December 31, 2021 and 2020 December 31 Increase or (Decrease) % Change Assets 2021 2020 $ Change Cash $179,300 $276,600 $ % Accounts receivable (net) 219,200 155,100 % Investments 272,000 148,800 % Inventories 1,059,200 979,100 % 25,100 25,100 % Prepaid expenses Plant and equipment Accumulated depreciation 2,590,500 1,963,600 % (997,700) (749,000 ) % Total $3,347,600 $2,799,300 % $74,800 $ % Liabilities and Stockholders' Equity Accounts $50,300 payable Accrued 168,700 expenses Bonds 454,100 payable 198,600 % 191,800 % Capital stock 2,088,100 1,776,400 % Retained earnings 586,400 557,700 % Total $3,347,600 $2,799,300 %
Step by Step Solution
There are 3 Steps involved in it

Get step-by-step solutions from verified subject matter experts