

Question: Please solve, having trouble! ASSIGNMENT 4 The following data represent the weights (in grams) of a simple random sample of 50 candies. 0.87 0.88 0.91
Please solve, having trouble!
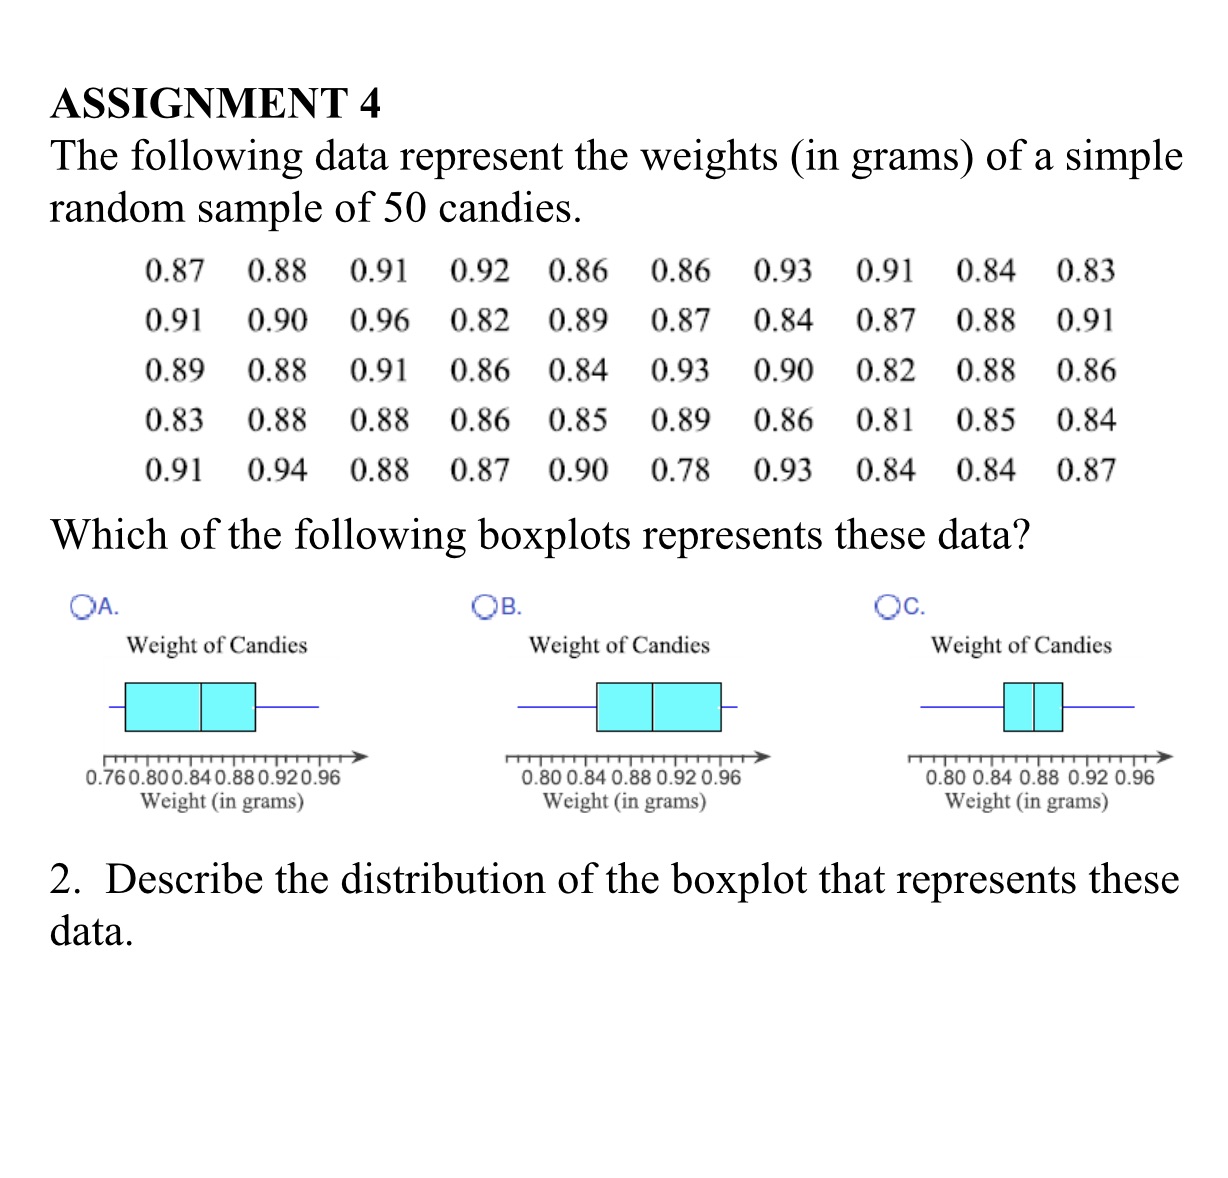
ASSIGNMENT 4 The following data represent the weights (in grams) of a simple random sample of 50 candies. 0.87 0.88 0.91 0.92 0.86 0.86 0.93 0.91 0.84 0.83 0.9] 0.90 0.96 0.82 0.89 0.87 0.84 0.87 0.88 0.91 0.89 0.88 0.91 0.86 0.84 0.93 0.90 0.82 0.88 0.86 0.83 0.88 0.88 0.86 0.85 0.89 0.86 0.81 0.85 0.84 0.91 0.94 0.88 0.87 0.90 0.78 0.93 0.84 0.84 0.87 Which of the following boxplots represents these data? DA. 03. 0c. Weight of Candies Weight of Candies Weight of Candies 0.76 0.80 0.840.88 0.92036 0.80 0.84 0.88 0.92 0.96 0.80 0.84 0.83 0.92 0.96 Weight (in grams) Weight (in grams) Weight (in grams) 2. Describe the distribution of the boxplot that represents these data
Step by Step Solution
There are 3 Steps involved in it

Get step-by-step solutions from verified subject matter experts