

Question: please solve in excel and show all steps/equations 2. a. The following table contains figures on the monthly volume and unit costs for a random
please solve in excel and show all steps/equations
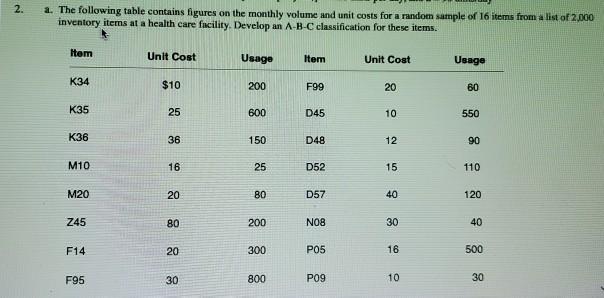
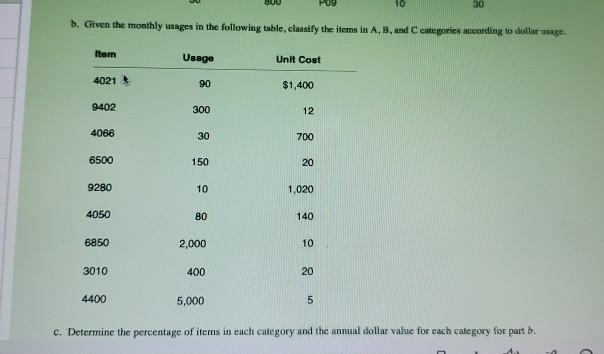
2. a. The following table contains figures on the monthly volume and unit costs for a random sample of 16 items from a list of 2.000 inventory items at a health care facility. Develop an A-B-C classification for these items. Hem Unit Cost Usage Item Unit Cost Usage K34 $10 200 F99 20 60 K35 25 600 D45 10 550 K36 36 150 D48 12 90 M10 16 25 D52 15 110 M20 20 80 D57 40 120 Z45 80 200 N08 30 40 F14 20 300 P05 16 500 F95 30 800 P09 10 30 10 30 d. Given the monthly usages in the following table classify the items in A, B, and Ceategories according to della sage Item Usage Unit Cost 4021 90 $1,400 9402 300 12 4066 30 700 6500 150 20 9280 10 1,020 4050 80 140 6850 2,000 10 3010 400 20 4400 5,000 5 e. Determine the percentage of items in each category and the annual dollar value for each category for part bStep by Step Solution
There are 3 Steps involved in it
1 Expert Approved Answer
Step: 1 Unlock

Question Has Been Solved by an Expert!
Get step-by-step solutions from verified subject matter experts
Step: 2 Unlock
Step: 3 Unlock