

Question: Please solve in Matlab! In this problem you will write a discrete-time simulation of a damped, linear oscillator, i.e. a mass-spring-damper system Write a discrete-time
Please solve in Matlab!
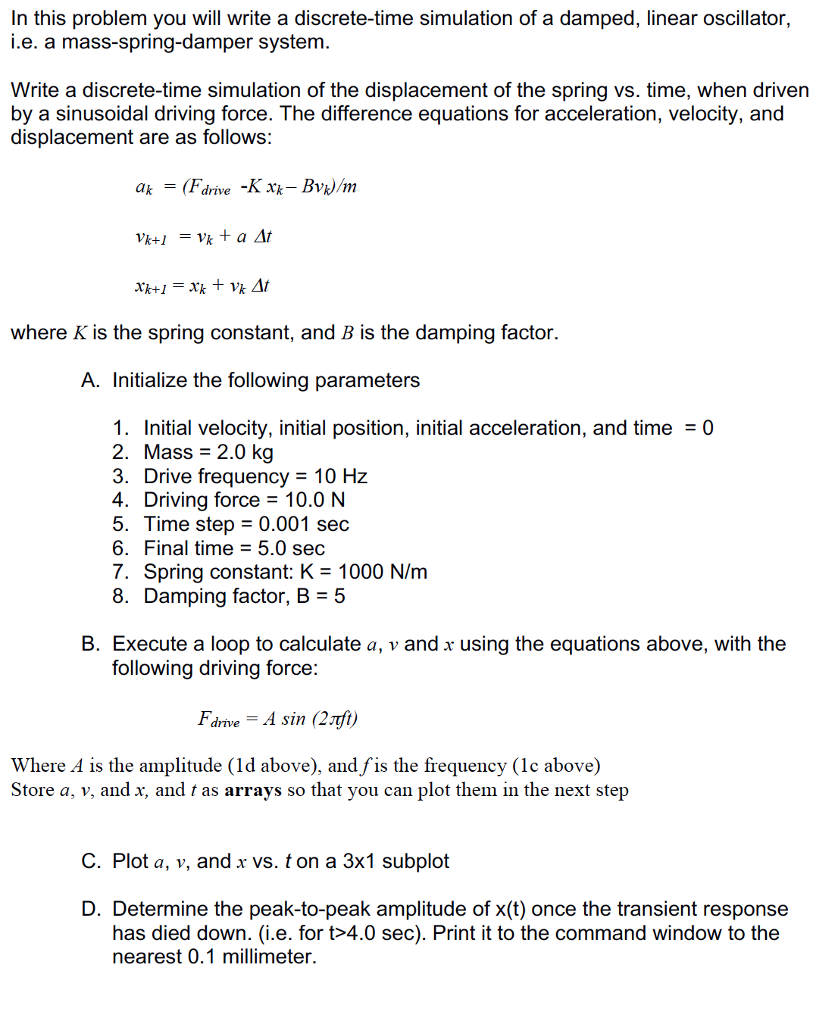
In this problem you will write a discrete-time simulation of a damped, linear oscillator, i.e. a mass-spring-damper system Write a discrete-time simulation of the displacement of the spring vs. time, when driven by a sinusoidal driving force. The difference equations for acceleration, velocity, and displacement are as follows: where K is the spring constant, and B is the damping factor. A. Initialize the following parameters 1. Initial velocity, initial position, initial acceleration, and time0 2. Mass 2.0 kg 3. Drive frequency 10 Hz 4. Driving force-10.0 N 5. Time step 0.001 sec 6. Final time 5.0 sec 7. Spring constant: K-1000 N/m 8. Damping factor, B-5 B. Execute a loop to calculate a, v and r using the equations above, with the following driving force: Farve = A sin (2tft) Where A is the amplitude (1d above), and fis the frequency (1c above) Store a, v, and x, and t as arrays so that you can plot them in the next step C. Plot a, v, and r vs. t on a 3x1 subplot D. Determine the peak-to-peak amplitude of x(t) once the transient response has died down. (i.e. for t>4.0 sec). Print it to the command window to the nearest 0.1 millimeter. In this problem you will write a discrete-time simulation of a damped, linear oscillator, i.e. a mass-spring-damper system Write a discrete-time simulation of the displacement of the spring vs. time, when driven by a sinusoidal driving force. The difference equations for acceleration, velocity, and displacement are as follows: where K is the spring constant, and B is the damping factor. A. Initialize the following parameters 1. Initial velocity, initial position, initial acceleration, and time0 2. Mass 2.0 kg 3. Drive frequency 10 Hz 4. Driving force-10.0 N 5. Time step 0.001 sec 6. Final time 5.0 sec 7. Spring constant: K-1000 N/m 8. Damping factor, B-5 B. Execute a loop to calculate a, v and r using the equations above, with the following driving force: Farve = A sin (2tft) Where A is the amplitude (1d above), and fis the frequency (1c above) Store a, v, and x, and t as arrays so that you can plot them in the next step C. Plot a, v, and r vs. t on a 3x1 subplot D. Determine the peak-to-peak amplitude of x(t) once the transient response has died down. (i.e. for t>4.0 sec). Print it to the command window to the nearest 0.1 millimeter
Step by Step Solution
There are 3 Steps involved in it

Get step-by-step solutions from verified subject matter experts