

Question: please solve it as soon as possible and explain well I will thumb you up 8. Consider the graph below - representing the effect monthly
please solve it as soon as possible and explain well I will thumb you up
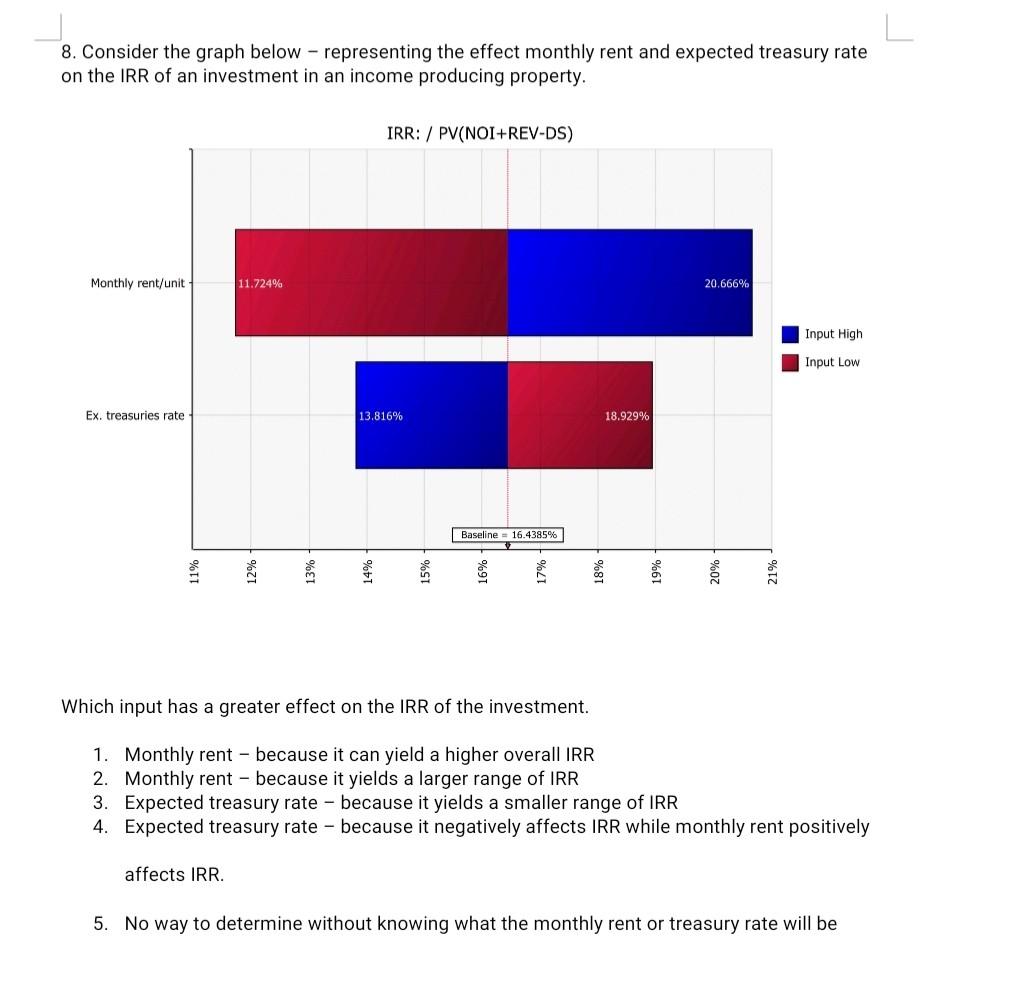
8. Consider the graph below - representing the effect monthly rent and expected treasury rate on the IRR of an investment in an income producing property. IRR: / PV(NOI+REV-DS) Monthly rent/unit 11.724% 20.666% Input High Input Low Ex. treasuries rate 13.816% 18.929% Baseline - 16.4385% 1170 12% 13% 14% 15% 0491 17% OLOT 19% 20% 21% Which input has a greater effect on the IRR of the investment. 1. Monthly rent - because it can yield a higher overall IRR 2. Monthly rent - because it yields a larger range of IRR 3. Expected treasury rate - because it yields a smaller range of IRR 4. Expected treasury rate - because it negatively affects IRR while monthly rent positively affects IRR. 5. No way to determine without knowing what the monthly rent or treasury rate will be
Step by Step Solution
There are 3 Steps involved in it

Get step-by-step solutions from verified subject matter experts