

Question: please solve it as soon as possible I will thumb you up Problem #1 Present your regression results as in the example below: your team
please solve it as soon as possible I will thumb you up
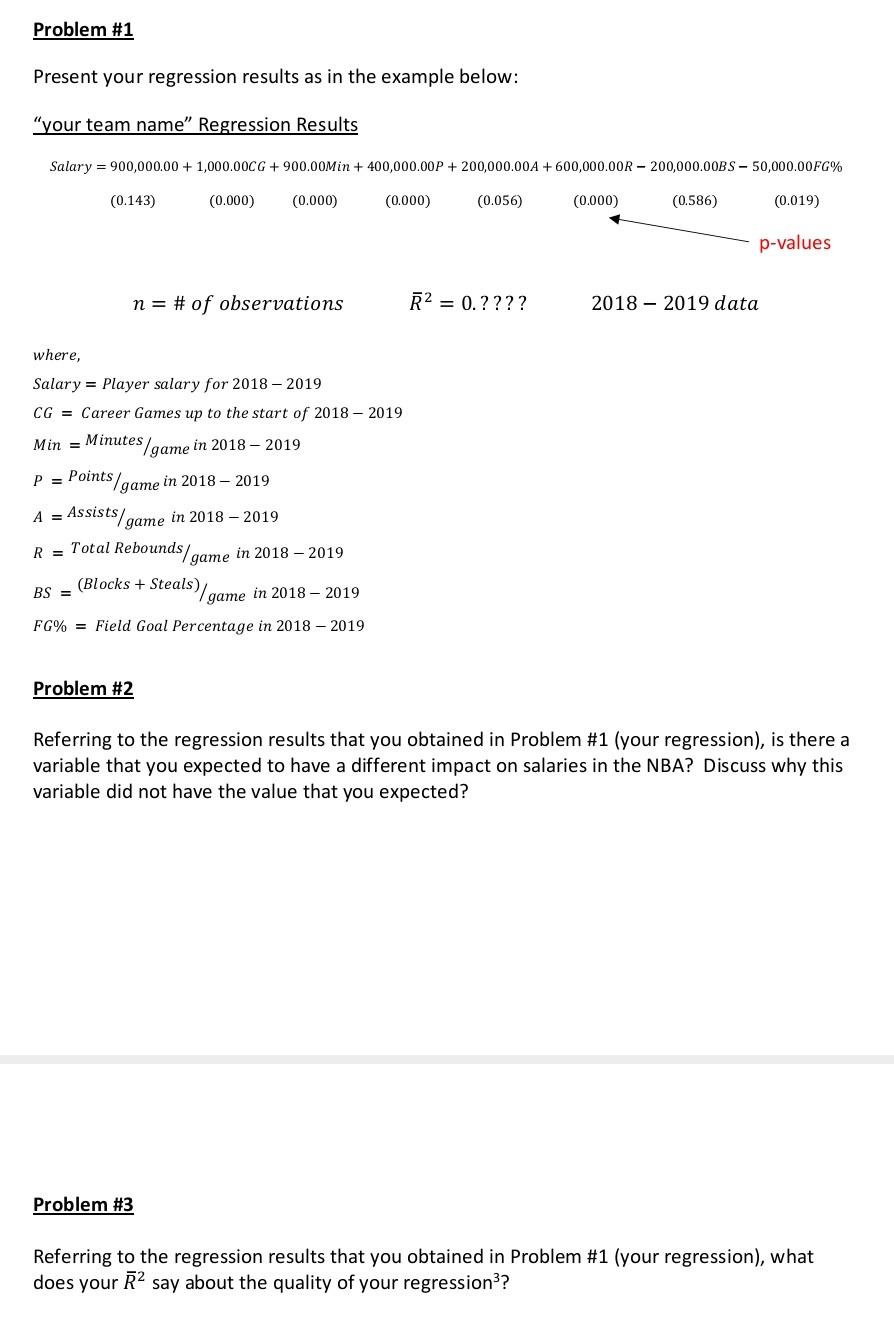
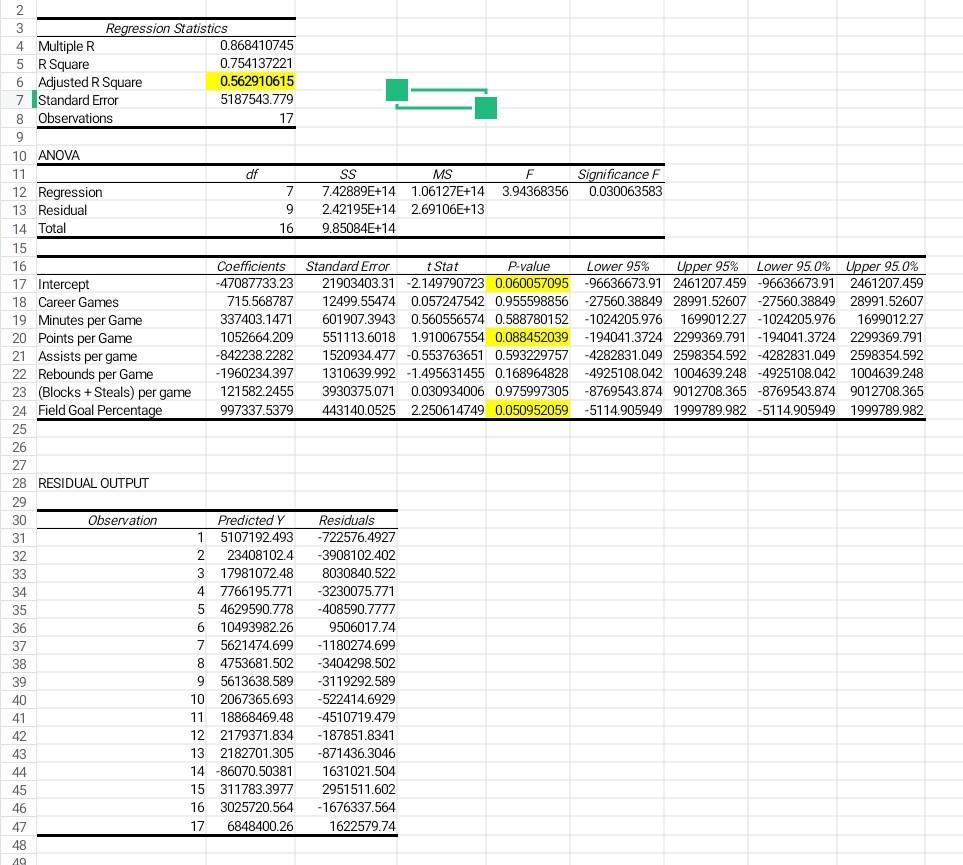
Problem #1 Present your regression results as in the example below: "your team name" Regression Results Salary = 900,000.00 + 1,000.00CG + 900.00Min + 400,000.00P + 200,000.00A + 600,000.00R - 200,000.00BS - 50,000.00FG% (0.143) (0.000) (0.000) (0.000) (0.056) (0.000) (0.586) (0.019) p-values n = # of observations R2 = 0.???? 2018 - 2019 data where, Salary = Player salary for 2018 - 2019 CG = Career Games up to the start of 2018 - 2019 Min = Minutes/game in 2018 - 2019 P = Points/game in 2018 - 2019 A = Assists/ game in 2018 - 2019 R = Total Rebounds/game in 2018 - 2019 (Blocks + Steals), game in 2018 2019 BS = FG% = Field Goal Percentage in 2018 - 2019 Problem #2 Referring to the regression results that you obtained in Problem #1 (your regression), is there a variable that you expected to have a different impact on salaries in the NBA? Discuss why this variable did not have the value that you expected? Problem #3 Referring to the regression results that you obtained in Problem #1 (your regression), what does your R2 say about the quality of your regression?? Significance F 0.030063583 2 3 Regression Statistics 4 Multiple R 0.868410745 5 R Square 0.754137221 6 Adjusted R Square 0.562910615 7 Standard Error 5187543.779 8 Observations 17 9 10 ANOVA 11 df SS MS F 12 Regression 7 7.42889E+14 1.06127E+14 3.94368356 13 Residual 9 2.42195E+14 2.69106E+13 14 Total 16 9.85084E+14 15 16 Coefficients Standard Error t Stat P-value 17 Intercept -47087733.23 21903403.31 2.149790723 0.060057095 18 Career Games 715.568787 12499.55474 0.057247542 0.955598856 19 Minutes per Game 337403.1471 601907.3943 0.560556574 0.588780152 20 Points per Game 1052664.209 551113.6018 1.910067554 0.088452039 21 Assists per game -842238.2282 1520934.477 -0.553763651 0.593229757 22 Rebounds per Game -1960234.397 1310639.992 -1.495631455 0.168964828 23 (Blocks + Steals) per game 121582.2455 3930375.071 0.030934006 0.975997305 24 Field Goal Percentage 997337.5379 443140.0525 2.250614749 0.050952059 25 26 27 28 RESIDUAL OUTPUT 29 30 Observation Predicted Y Residuals 31 1 5107192.493 -722576.4927 32 2 23408102.4 -3908102.402 33 3 17981072.48 8030840.522 34 4 7766195.771 -3230075.771 35 5 4629590.778 -408590.7777 36 6 10493982.26 9506017.74 37 7 5621474.699 -1180274.699 38 8 4753681.502 -3404298.502 39 9 5613638.589 -3119292.589 40 10 2067365.693 -522414.6929 41 11 18868469.48 -4510719.479 42 12 2179371.834 -187851.8341 43 13 2182701.305 -871436.3046 44 14 -86070.50381 1631021.504 45 15 311783.3977 2951511.602 46 16 3025720.564 - 1676337.564 47 17 6848400.26 1622579.74 Lower 95% Upper 95% Lower 95.0% Upper 95.0% -96636673.91 2461207.459-96636673.91 2461207.459 -27560.38849 28991.52607-27560.38849 28991,52607 -1024205.976 1699012.27 -1024205.976 169901227 -194041.3724 2299369.791 -194041.3724 2299369.791 -4282831.049 2598354.592 -4282831.049 2598354.592 -4925108.042 1004639.248 -4925108.042 1004639.248 -8769543.874 9012708.365 -8769543.874 9012708.365 -5114.905949 1999789.982 -5114.905949 1999789.982 48 40 Problem #1 Present your regression results as in the example below: "your team name" Regression Results Salary = 900,000.00 + 1,000.00CG + 900.00Min + 400,000.00P + 200,000.00A + 600,000.00R - 200,000.00BS - 50,000.00FG% (0.143) (0.000) (0.000) (0.000) (0.056) (0.000) (0.586) (0.019) p-values n = # of observations R2 = 0.???? 2018 - 2019 data where, Salary = Player salary for 2018 - 2019 CG = Career Games up to the start of 2018 - 2019 Min = Minutes/game in 2018 - 2019 P = Points/game in 2018 - 2019 A = Assists/ game in 2018 - 2019 R = Total Rebounds/game in 2018 - 2019 (Blocks + Steals), game in 2018 2019 BS = FG% = Field Goal Percentage in 2018 - 2019 Problem #2 Referring to the regression results that you obtained in Problem #1 (your regression), is there a variable that you expected to have a different impact on salaries in the NBA? Discuss why this variable did not have the value that you expected? Problem #3 Referring to the regression results that you obtained in Problem #1 (your regression), what does your R2 say about the quality of your regression?? Significance F 0.030063583 2 3 Regression Statistics 4 Multiple R 0.868410745 5 R Square 0.754137221 6 Adjusted R Square 0.562910615 7 Standard Error 5187543.779 8 Observations 17 9 10 ANOVA 11 df SS MS F 12 Regression 7 7.42889E+14 1.06127E+14 3.94368356 13 Residual 9 2.42195E+14 2.69106E+13 14 Total 16 9.85084E+14 15 16 Coefficients Standard Error t Stat P-value 17 Intercept -47087733.23 21903403.31 2.149790723 0.060057095 18 Career Games 715.568787 12499.55474 0.057247542 0.955598856 19 Minutes per Game 337403.1471 601907.3943 0.560556574 0.588780152 20 Points per Game 1052664.209 551113.6018 1.910067554 0.088452039 21 Assists per game -842238.2282 1520934.477 -0.553763651 0.593229757 22 Rebounds per Game -1960234.397 1310639.992 -1.495631455 0.168964828 23 (Blocks + Steals) per game 121582.2455 3930375.071 0.030934006 0.975997305 24 Field Goal Percentage 997337.5379 443140.0525 2.250614749 0.050952059 25 26 27 28 RESIDUAL OUTPUT 29 30 Observation Predicted Y Residuals 31 1 5107192.493 -722576.4927 32 2 23408102.4 -3908102.402 33 3 17981072.48 8030840.522 34 4 7766195.771 -3230075.771 35 5 4629590.778 -408590.7777 36 6 10493982.26 9506017.74 37 7 5621474.699 -1180274.699 38 8 4753681.502 -3404298.502 39 9 5613638.589 -3119292.589 40 10 2067365.693 -522414.6929 41 11 18868469.48 -4510719.479 42 12 2179371.834 -187851.8341 43 13 2182701.305 -871436.3046 44 14 -86070.50381 1631021.504 45 15 311783.3977 2951511.602 46 16 3025720.564 - 1676337.564 47 17 6848400.26 1622579.74 Lower 95% Upper 95% Lower 95.0% Upper 95.0% -96636673.91 2461207.459-96636673.91 2461207.459 -27560.38849 28991.52607-27560.38849 28991,52607 -1024205.976 1699012.27 -1024205.976 169901227 -194041.3724 2299369.791 -194041.3724 2299369.791 -4282831.049 2598354.592 -4282831.049 2598354.592 -4925108.042 1004639.248 -4925108.042 1004639.248 -8769543.874 9012708.365 -8769543.874 9012708.365 -5114.905949 1999789.982 -5114.905949 1999789.982 48 40
Step by Step Solution
There are 3 Steps involved in it

Get step-by-step solutions from verified subject matter experts