

Question: Please solve it by hand or typing, don't use EXCEL. 1. The following data was downloaded from Professor Kenneth French's website. The table shows the
Please solve it by hand or typing, don't use EXCEL.
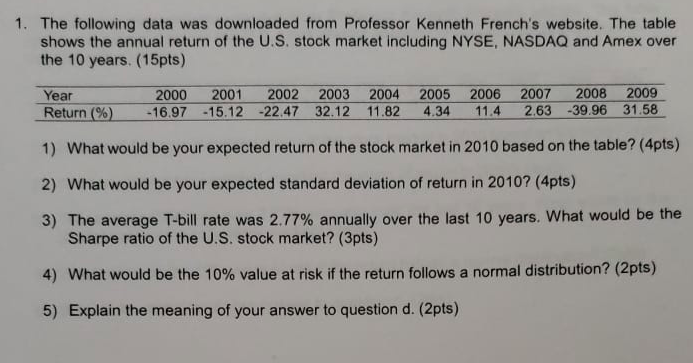
1. The following data was downloaded from Professor Kenneth French's website. The table shows the annual return of the U.S. stock market including NYSE, NASDAQ and Amex over the 10 years. (15pts) Year 2000 2001 2002 2003 2004 2005 2006 2007 2008 2009 Return (%) -16.97-15.12-22.47 32.12 11.82 4.34 11.4 263-39 96 3158 1) What would be your expected return of the stock market in 2010 based on the table? (4pts) 2) What would be your expected standard deviation of return in 2010? (4pts) 3) The average T-bill rate was 2.77% annually over the last 10 years, what would be the Sharpe ratio of the U.S. stock market? (3pts) 4) What would be the 10% value at risk if the return follows a normal distribution? (2pts) 5) Explain the meaning of your answer to question d. (2pts)
Step by Step Solution
There are 3 Steps involved in it

Get step-by-step solutions from verified subject matter experts