

Question: Please solve it quickly Q2/ Figure below shows the plot of r=1+4sin(50) -2- a. Describe the behavior of the graph in terms of the given
Please solve it quickly
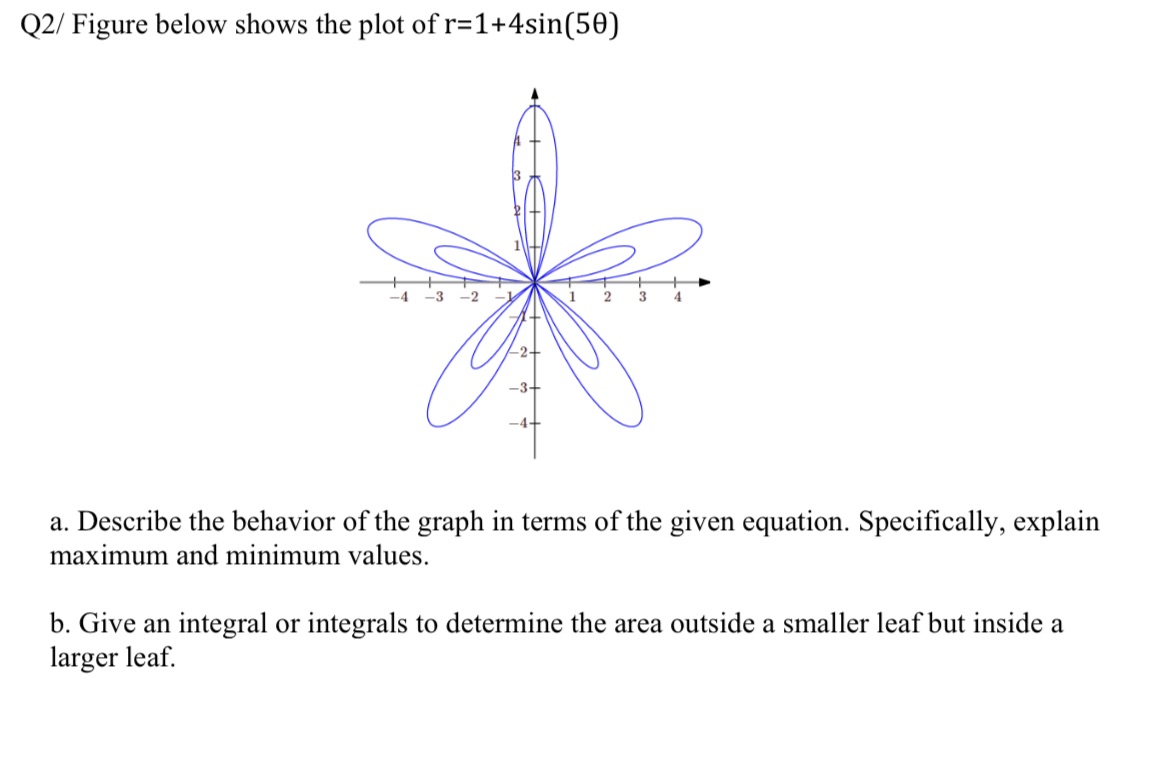
Q2/ Figure below shows the plot of r=1+4sin(50) -2- a. Describe the behavior of the graph in terms of the given equation. Specifically, explain maximum and minimum values. b. Give an integral or integrals to determine the area outside a smaller leaf but inside a larger leaf
Step by Step Solution
There are 3 Steps involved in it
1 Expert Approved Answer
Step: 1 Unlock

Question Has Been Solved by an Expert!
Get step-by-step solutions from verified subject matter experts
Step: 2 Unlock
Step: 3 Unlock