

Question: Please solve it step by step cardholder (a frequent guest staying more than 45 nights a year in the hotel), they would receive $200 cash
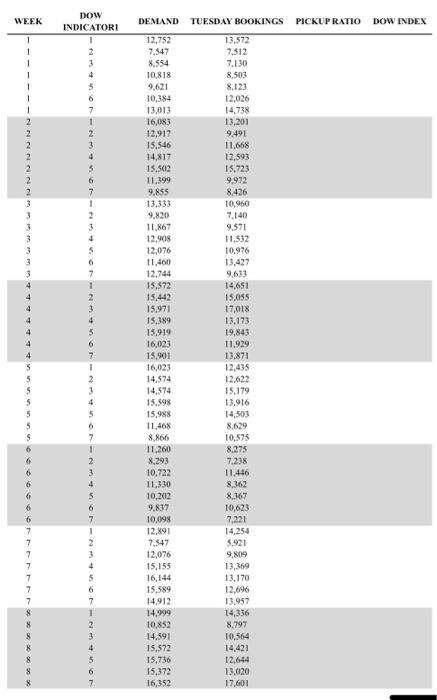
cardholder (a frequent guest staying more than 45 nights a year in the hotel), they would receive $200 cash plus the next two stays at Marriott free. Snow was not sure how to put a cost figure on a denied room. In her judgment, it should be valued - good will and all - at about twice the contribution figure. Forecasting Snow focused on getting a good forecast for Saturday, August 22, and making a decision on whether to accept the additional reservations for that day. She had historical data on demand for rooms in the hotel. Exhibit 1 shows demand for dates starting with Saturday, May 23, 1987. (Saturday, August 22, was the beginning of week 14 in this database.) Demand figures included the number of turned-down requests for a reservation on a night when the hotel had stopped taking reservations because of capacity, plus the number of rooms actually occupied that night. Also included in Exhibit 1 is the number of rooms booked as of the Tuesday morning of the week prior to each date. (Note that this Tuesday precedes a date by a number of days that depends on the date's day of week. It is four days ahead of a Saturday date; seven days ahead of a Tuesday; ten days ahead of a Friday. Also, note that on a Tuesday morning, actual demand is known for Monday night, but not for Tuesday night.) Snow had calculated pickup ratios for each date where actual demand was known in Exhibit 1. Between a Tuesday one week ahead and any date, new reservations were added, reservations were cancelled, some reservations were extended to more nights, some were shortened, and some resulted in noshows. The net effect was a final demand that might be larger than Tuesday bookings (a pickup ratio greater than 1.0) or smaller than Tuesday bookings (a pickup ratio less than 1.0). Snow looked at her forecasting task as one of predicting the pickup ratio. With a good forecast of pickup ratio, she could simply multiply by Tuesday bookings to obtain a forecast of demand. From her earliest experience in a hotel, Snow was aware that the day of the week (DOW) made a lot of difference in the demand for rooms, her recent experience in reservations suggested that it was key in forecasting pickup ratios. Downtown business hotels like hers tended to be busiest in the middle of the workweek (Tuesday, Wednesday, and Thursday) and light on the weekends. Using the data in Exhibit 1, she had calculated a DOW index for the pickup ratio during each day of the week, which is shown in the last column of Exhibit 1. Thus, for example, the average pickup ratio for Saturday is about 86.5% of the average pickup ratio for all days of the week. Her plan was to adjust the data for this DOW effect by dividing each pickup ratio by that factor. This adjustment would take out the DOW effect, and put the pickup ratios on the same footing. Then she could use the stream of adjusted pickup ratios to forecast Saturday's adjusted pickup ratio. To do this, she needed to think about how to level out the peaks and valleys of demand, which she knew from experience could not be forecasted. Once she had the forecast of adjusted pickup ratio, then she could multiply it by the Saturday DOW index to get back to an unadjusted pickup ratio. -Let's get on with it," she said to herself. "I need to get an answer back on that request for 60 reservations." Your report shall answer the following questions: 1. What forecasting procedure would you recommend for making the Tuesday afternoon forecast of each day's demand for the following Saturday through Friday? 2. calculate the MAD, MAPE and MSE for the selected forecasting methods. 3. What is your forecast for Saturday? Use both deseasonalization approaches discussed in class. 4. What will you do about the current request for up to 60 rooms for Saturday? cardholder (a frequent guest staying more than 45 nights a year in the hotel), they would receive $200 cash plus the next two stays at Marriott free. Snow was not sure how to put a cost figure on a denied room. In her judgment, it should be valued - good will and all - at about twice the contribution figure. Forecasting Snow focused on getting a good forecast for Saturday, August 22, and making a decision on whether to accept the additional reservations for that day. She had historical data on demand for rooms in the hotel. Exhibit 1 shows demand for dates starting with Saturday, May 23, 1987. (Saturday, August 22, was the beginning of week 14 in this database.) Demand figures included the number of turned-down requests for a reservation on a night when the hotel had stopped taking reservations because of capacity, plus the number of rooms actually occupied that night. Also included in Exhibit 1 is the number of rooms booked as of the Tuesday morning of the week prior to each date. (Note that this Tuesday precedes a date by a number of days that depends on the date's day of week. It is four days ahead of a Saturday date; seven days ahead of a Tuesday; ten days ahead of a Friday. Also, note that on a Tuesday morning, actual demand is known for Monday night, but not for Tuesday night.) Snow had calculated pickup ratios for each date where actual demand was known in Exhibit 1. Between a Tuesday one week ahead and any date, new reservations were added, reservations were cancelled, some reservations were extended to more nights, some were shortened, and some resulted in noshows. The net effect was a final demand that might be larger than Tuesday bookings (a pickup ratio greater than 1.0) or smaller than Tuesday bookings (a pickup ratio less than 1.0). Snow looked at her forecasting task as one of predicting the pickup ratio. With a good forecast of pickup ratio, she could simply multiply by Tuesday bookings to obtain a forecast of demand. From her earliest experience in a hotel, Snow was aware that the day of the week (DOW) made a lot of difference in the demand for rooms, her recent experience in reservations suggested that it was key in forecasting pickup ratios. Downtown business hotels like hers tended to be busiest in the middle of the workweek (Tuesday, Wednesday, and Thursday) and light on the weekends. Using the data in Exhibit 1, she had calculated a DOW index for the pickup ratio during each day of the week, which is shown in the last column of Exhibit 1. Thus, for example, the average pickup ratio for Saturday is about 86.5% of the average pickup ratio for all days of the week. Her plan was to adjust the data for this DOW effect by dividing each pickup ratio by that factor. This adjustment would take out the DOW effect, and put the pickup ratios on the same footing. Then she could use the stream of adjusted pickup ratios to forecast Saturday's adjusted pickup ratio. To do this, she needed to think about how to level out the peaks and valleys of demand, which she knew from experience could not be forecasted. Once she had the forecast of adjusted pickup ratio, then she could multiply it by the Saturday DOW index to get back to an unadjusted pickup ratio. -Let's get on with it," she said to herself. "I need to get an answer back on that request for 60 reservations." Your report shall answer the following questions: 1. What forecasting procedure would you recommend for making the Tuesday afternoon forecast of each day's demand for the following Saturday through Friday? 2. calculate the MAD, MAPE and MSE for the selected forecasting methods. 3. What is your forecast for Saturday? Use both deseasonalization approaches discussed in class. 4. What will you do about the current request for up to 60 rooms for Saturday
Step by Step Solution
There are 3 Steps involved in it

Get step-by-step solutions from verified subject matter experts