

Question: Please solve last equation Step 4 Now that we have the observed and expected frequencies, the other components for the test statistic can be found.
Please solve last equation
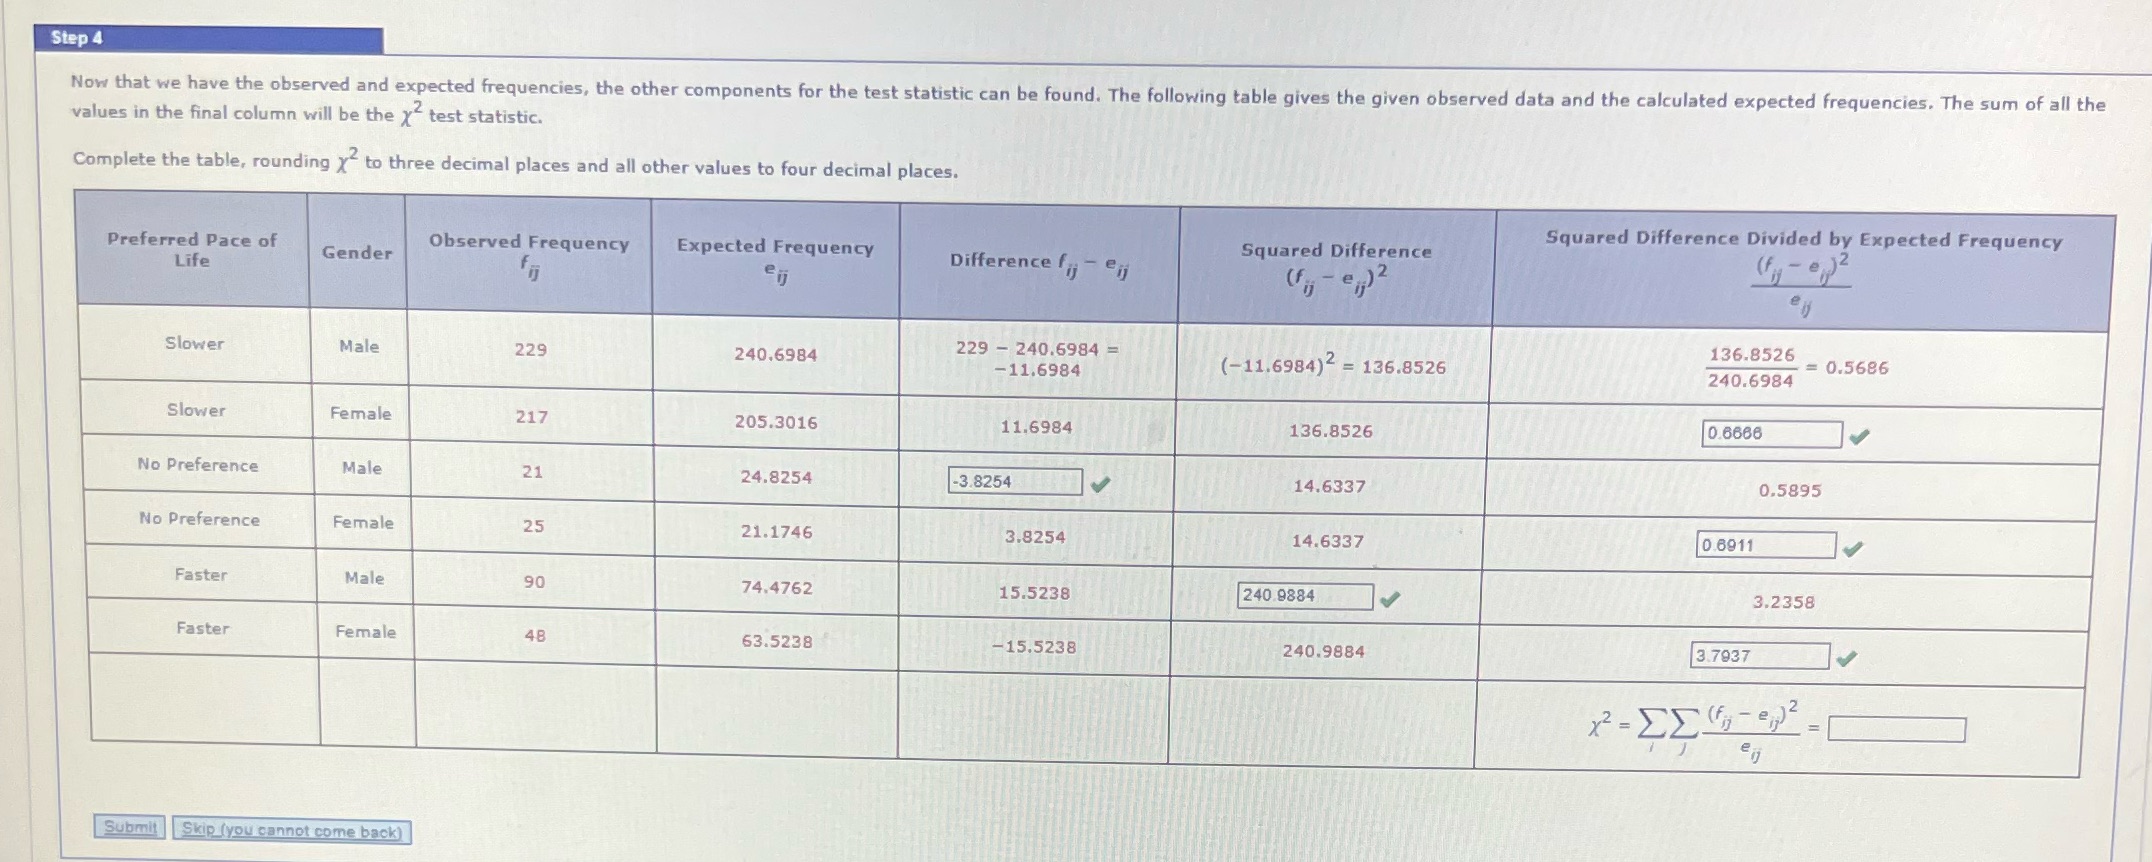
Step 4 Now that we have the observed and expected frequencies, the other components for the test statistic can be found. The following table gives the given observed data and the calculated expected frequencies. The sum of all the values in the final column will be the y test statistic. Complete the table, rounding x to three decimal places and all other values to four decimal places. Squared Difference Divided by Expected Frequency Preferred Pace of Gender Observed Frequency Expected Frequency Squared Difference Life Difference fij - eij eij (fig - e ) 2 Slower Male 229 229 - 240.6984 = 136.8526 240.6984 - = 0.5686 -11.6984 (-11.6984)2 = 136.8526 240.6984 Slower Female 217 205.3016 11.6984 136.8526 0.6686 No Preference Male 21 24.8254 -3.8254 14.6337 0.5895 No Preference Female 25 21.1746 3.8254 14.6337 0.6911 Faster Male 90 74.4762 15.5238 240.9884 3.2358 Faster Female 48 63.5238 -15.5238 240.9884 3.7937 v Submit Skip (you cannot come back)
Step by Step Solution
There are 3 Steps involved in it

Get step-by-step solutions from verified subject matter experts