

Question: please solve manually and help me understand how to graph two way analysis comparing two options. Joe is considering the following two lotteries. In lottery
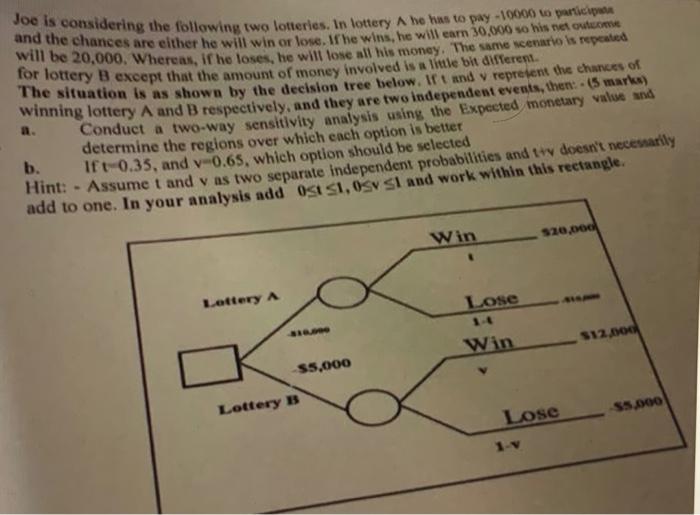
Joe is considering the following two lotteries. In lottery he has to pay 10000 w participen and the chances are either he will win or lose. If the wins, he will earn 30,000 so his net outuons will be 20,000 . Whereas, if he loses, he will lose all his money. The same scenarte is repeated for lottery B except that the amount of money involved is a littie bil different. The situation is as shown by the decision tree below. If 1 and y represent the chances of winning lottery A and B respectively, and they are two tndependent events, then: - (5 marke) a. Conduct a two-way sensitivity analysis using the Expected monetary value and determine the regions over which each option is bettet b. If t0.35, and v=0.65, which option should be selected Hint: - Assume t and v as two separate independent probabilities and tw doesn't nesesarily add to one
Step by Step Solution
There are 3 Steps involved in it

Get step-by-step solutions from verified subject matter experts