

Question: please solve only 9/10/11 and please put number before each solution i puted some formulas too Nordstrom Inc. has select stores across Canada that compete
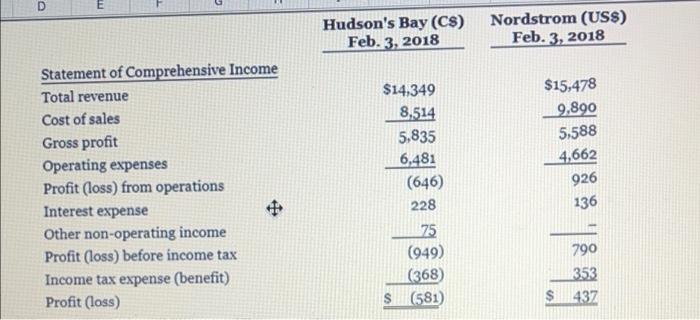
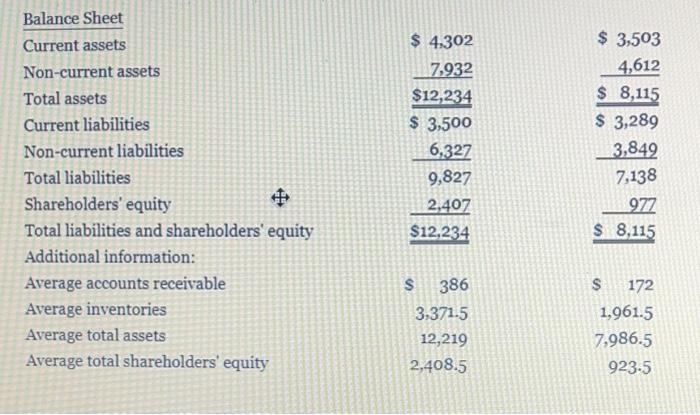
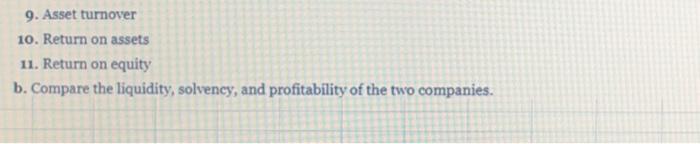
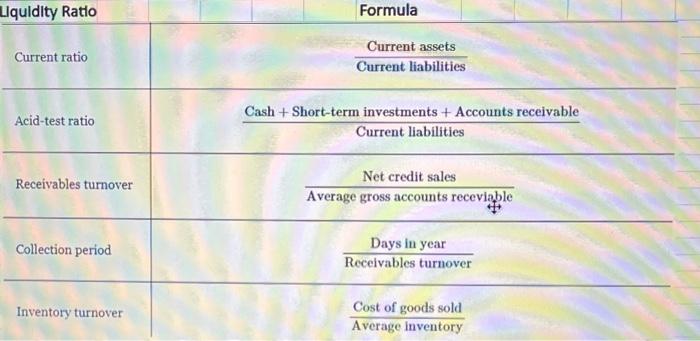
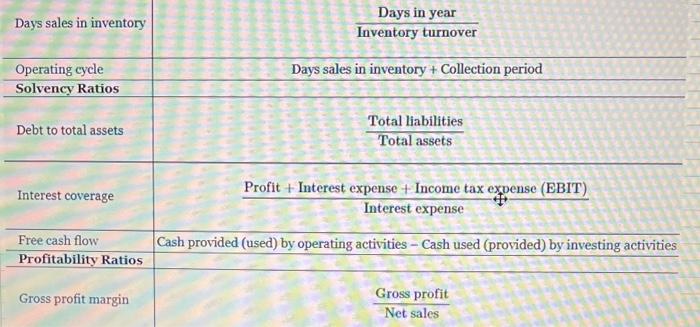
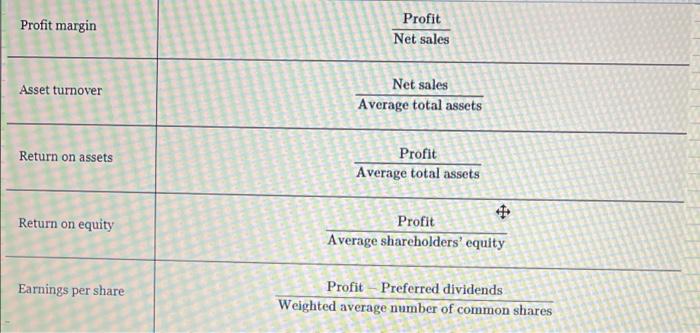
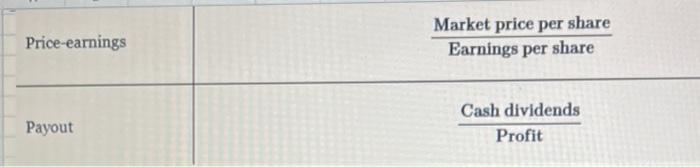
Nordstrom Inc. has select stores across Canada that compete against Hudson's Bay Company and other higher-end retailers. Selected financial data (in millions) for the two companies' global operations are presented here. Calculate and evaluate ratios. D Hudson's Bay (C$) Feb. 3, 2018 Nordstrom (USS) Feb. 3, 2018 Statement of Comprehensive Income Total revenue Cost of sales Gross profit Operating expenses Profit (loss) from operations Interest expense Other non-operating income Profit (loss) before income tax Income tax expense (benefit) Profit (loss) $14,349 8.514 5,835 6,481 (646) 228 75 (949) (368) S (581) $15,478 9,890 5,588 4,662 926 136 # 790 353 $437 Balance Sheet Current assets Non-current assets Total assets Current liabilities Non-current liabilities Total liabilities Shareholders' equity Total liabilities and shareholders' equity Additional information: Average accounts receivable Average inventories Average total assets Average total shareholders' equity $ 4.302 7,932 $12,234 $ 3,500 6,327 9,827 2,407 $12,234 $ 3,503 4,612 $ 8,115 $ 3,289 3,849 7,138 977 $ 8,115 $ 386 3,371.5 12,219 2,408.5 $ 172 1,961.5 7,986.5 923.5 9. Asset turnover 10. Return on assets 11. Return on equity b. Compare the liquidity, solvency, and profitability of the two companies. Liquidity Ratio Formula Current ratio Current assets Current liabilities Acid-test ratio Cash + Short-term investments + Accounts receivable Current liabilities Receivables turnover Net credit sales Average gross accounts receviable Collection period Days in year Receivables turnover Inventory turnover Cost of goods sold Average inventory Days sales in inventory Days in year Inventory turnover Days sales in inventory Collection period Operating cycle Solvency Ratios Debt to total assets Total liabilities Total assets Interest coverage Profit + Interest expense + Income tax expense (EBIT) Interest expense Free cash flow Profitability Ratios Cash provided (used) by operating activities - Cash used (provided) by investing activities Gross profit margin Gross profit Net sales Profit margin Profit Net sales Asset turnover Net sales Average total assets Return on assets Profit Average total assets Return on equity Profit Average shareholders' equity Earnings per share Profit - Preferred dividends Weighted average number of common shares Price-earnings Market price per share Earnings per share Payout Cash dividends Profit
Step by Step Solution
There are 3 Steps involved in it

Get step-by-step solutions from verified subject matter experts