

Question: Please solve, only part e, Thank you Given the following information for a one-year project, answer the following questions. Assume you have actual and earned
Please solve, only part e, Thank you
Given the following information for a one-year project, answer the following questions. Assume you have actual and earned value data at the end of the second month. Recall that PV is the planned value, EV is the earned value, AC is the actual cost, and BAC is the budget at completion.
PV = $23,000, EV = $20,000, AC = $25,000, BAC = $120,000
- the cost variance, schedule variance, cost performance index (CPI), and schedule performance index (SPI) for the project:
Cost Variance = EV-AC = 20,000-25,000= -$5,000
Schedule Variance = EV-PV = 20,000-23,000= - $3,000
CPI= EV/AC = 20,000/25,000 = 0.8
SPI = EV/PV =20,000/23,000 = 0.87
When SPI is less than 1 then it indicates that the project is behind schedule to date. In this case SPI value is 0.87 which is less then 1, so it indicates it is behind schedule.
Also, negative schedule variance means that a project is behind schedule
As the cost variance is negative it implies that project is under budget.
EAC = BAC/CPI = 120,000/0.8 = $150,000
Please note this is the case when we assume that this project will continue to perform to the end as it was performing until now. i.e. the CPI will remain the same for the rest of the project.
EAC = AC+ (BAC-EV)/(CPI*SPI)
=25,000 + (120,000-20,000)/ (0.8*0.87)
= 25,000 + (100,000/0.696)
=25,000 + 143,678
= 168,678
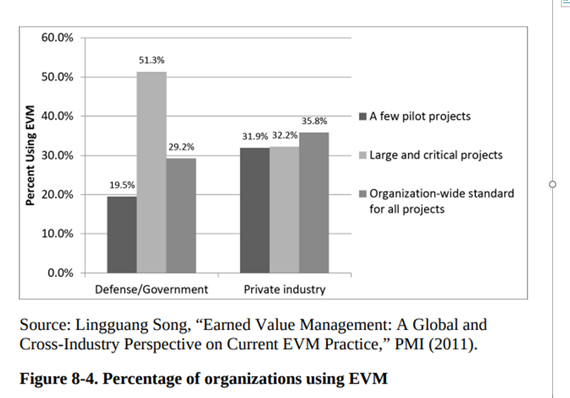
e. Sketch the earned value chart for this project, using Figure 8-4 as
a guide. Assume the data for month 1 is half of the values given
for PV, EV, and AC at the end of month 2.
Step by Step Solution
There are 3 Steps involved in it

Get step-by-step solutions from verified subject matter experts