

Question: please solve part b and part c only that part is wrong Bars of Rex Crunch, an energy snack bar, are labelled net: 60 g.
please solve part b and part c only that part is wrong
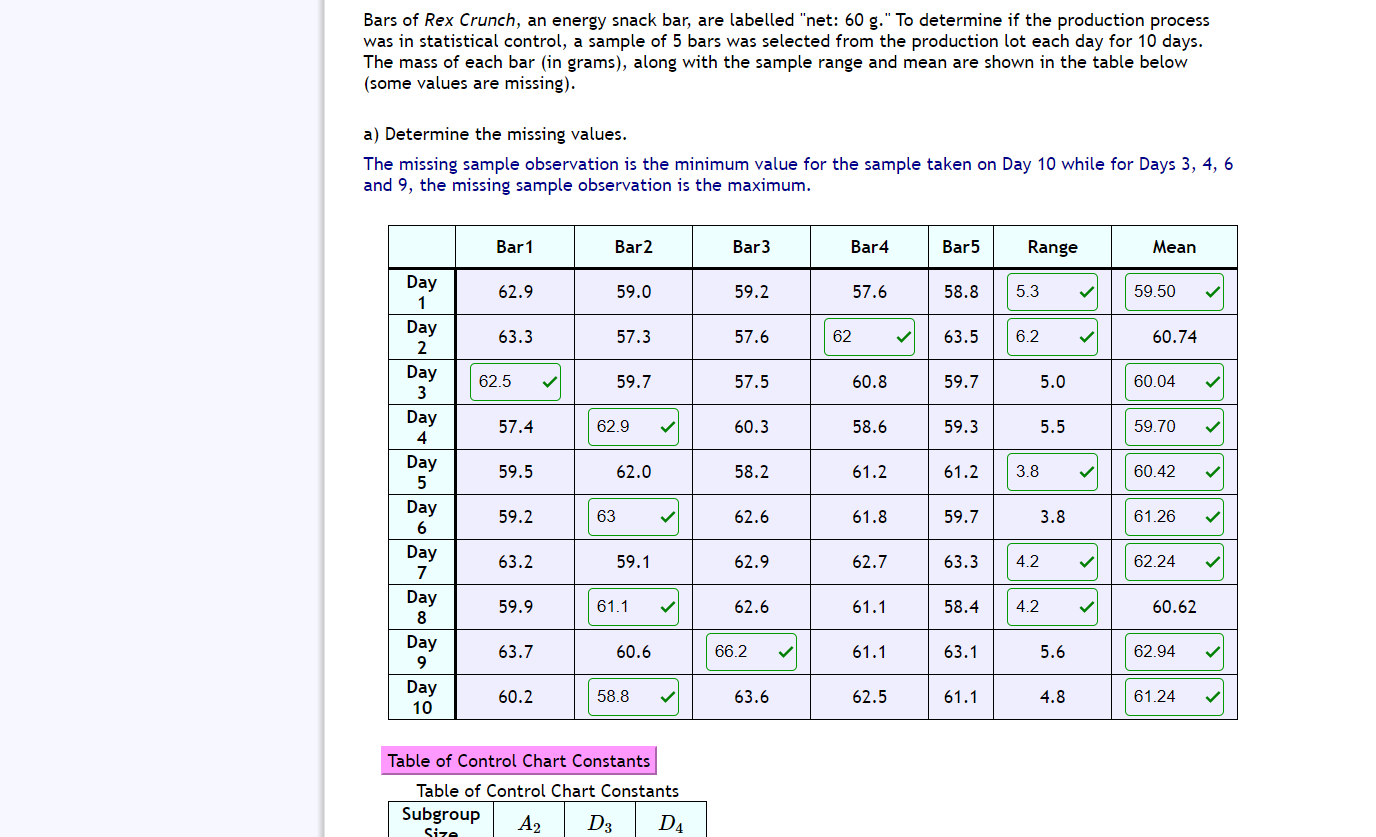
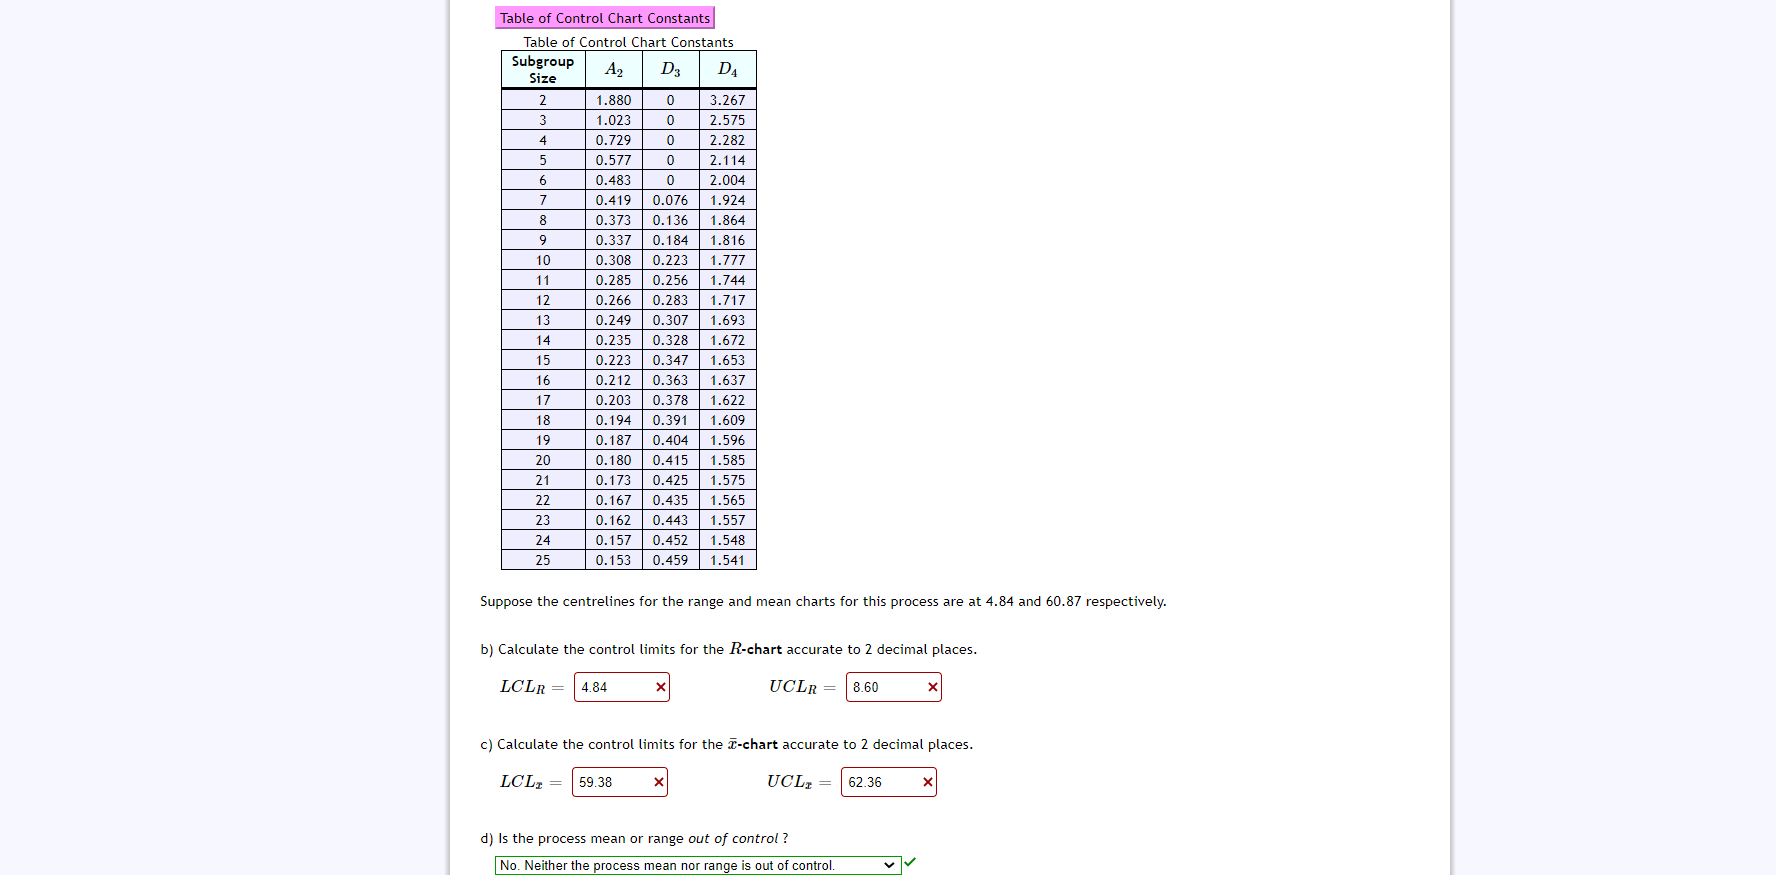
Bars of Rex Crunch, an energy snack bar, are labelled "net: 60 g." To determine if the production process was in statistical control, a sample of 5 bars was selected from the production lot each day for 10 days. The mass of each bar (in grams}, along with the sample range and mean are shown in the table below (some values are missing). a} Determine the missing values. The missing sample observation is the minimum value for the sample taken on Day 10 while for Days 3, 4, 6 and 9, the missing sample observation is the maximum. Bar1 BarZ Bar3 Bar4 Bar5 Range Mean '3?" 62.9 59.0 59.2 57.6 58.8 5050 w \"3" 63.3 57.3 57.6 62 v 63.5 . 60.74 \":3\" 62.5 59.7 57.5 60.8 59.7 5.0 60.04 V \":5" 57.4 62.9 60.3 58.6 59.3 5.5 59.70 v \"2" 59.5 62.0 56.2 61.2 61.2 3.5 ./ 60.42 4/ \"2" 59.2 63 v 62.6 61.8 59.7 3.6 61.26 V I)?" 63.2 59.1 62.9 62.7 63.3 4.2 ./ 62.24 4/ \"2" 59.9 61.1 v 62.6 61.1 58 .4 4.2 w 60.62 \":5" 63.7 60.6 66.2 61.1 63.1 5.6 62.94 .x D133\" 60.2 58.8 63.6 62.5 61.1 4.8 61.24 Table of Control Chart Constants Table of Control Chart Constants 'Subgroup A2 ' D3 ' D4 ' (i-n: Table of Control Chart Constants Table of Control Chart Constants Subgroup D3 DA Size A2 2 1.880 0 3.267 3 1.023 0 2.575 4 0.729 0 2.282 5 0.577 0 2.114 6 0.483 2.004 7 0.419 0.076 1.924 8 0.373 0.136 1.864 9 0.337 0.184 1.816 10 0.308 0.223 1.777 11 0.285 0.256 1.744 12 0.266 0.283 1.717 13 0.249 0.307 1.693 14 0.235 0.328 1.672 15 0.223 0.347 1.653 16 0.212 0.363 1.637 17 0.203 0.378 1.622 18 0. 194 0.391 1.609 19 0.187 0.404 1.596 20 0. 180 0.415 1.585 21 0. 173 0.425 1.575 22 0. 167 0.435 1.565 23 0. 162 0.443 1.557 24 0.157 0.452 1.548 75 0.153 0.459 1.541 Suppose the centrelines for the range and mean charts for this process are at 4.84 and 60.87 respectively. b) Calculate the control limits for the R-chart accurate to 2 decimal places. LCLR = 4.84 x UCLR = 8.60 c) Calculate the control limits for the -chart accurate to 2 decimal places. LCLI 59.38 X UCLI 62.36 X d) Is the process mean or range out of control ? No. Neither the process mean nor range is out of control
Step by Step Solution
There are 3 Steps involved in it

Get step-by-step solutions from verified subject matter experts