

Question: Please solve Part C and D on Excel showing the Formulas. The following table contains information about the estimated next year's EPS, payout ratio, shareholders'
Please solve Part C and D on Excel showing the Formulas.
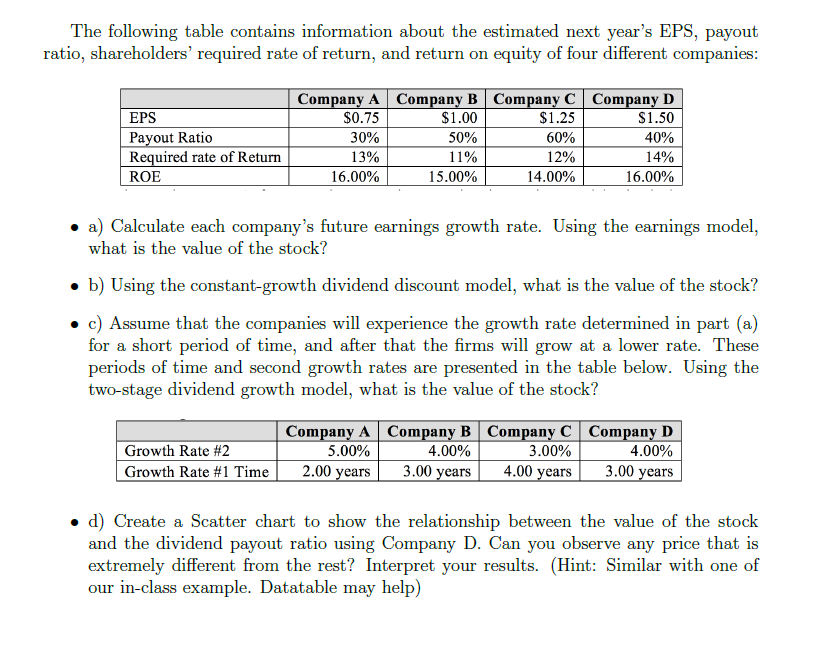
The following table contains information about the estimated next year's EPS, payout ratio, shareholders' required rate of return, and return on equity of four different companies: - a) Calculate each company's future earnings growth rate. Using the earnings model, what is the value of the stock? - b) Using the constant-growth dividend discount model, what is the value of the stock? - c) Assume that the companies will experience the growth rate determined in part (a) for a short period of time, and after that the firms will grow at a lower rate. These periods of time and second growth rates are presented in the table below. Using the two-stage dividend growth model, what is the value of the stock? - d) Create a Scatter chart to show the relationship between the value of the stock and the dividend payout ratio using Company D. Can you observe any price that is extremely different from the rest? Interpret your results. (Hint: Similar with one of our in-class example. Datatable may help)
Step by Step Solution
There are 3 Steps involved in it

Get step-by-step solutions from verified subject matter experts