

Question: please solve problem 1 in matlap Write a single live script with a proper header with your name, class, date and assignment. Create section breaks
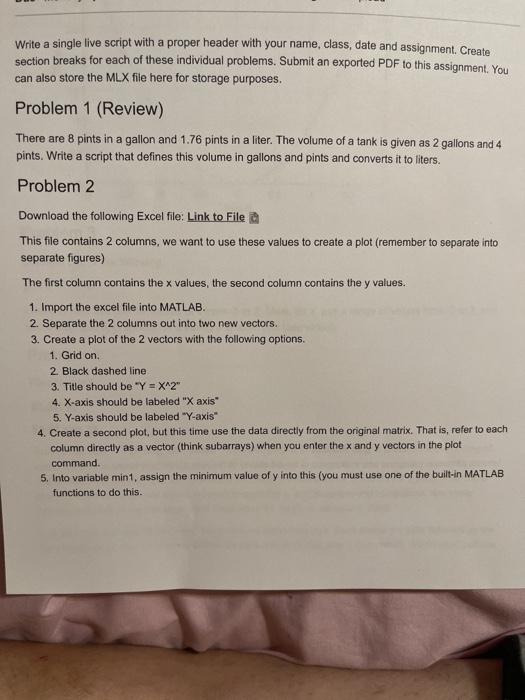
Write a single live script with a proper header with your name, class, date and assignment. Create section breaks for each of these individual problems. Submit an exported PDF to this assignment. You can also store the MLX file here for storage purposes. Problem 1 (Review) There are 8 pints in a gallon and 1.76 pints in a liter. The volume of a tank is given as 2 gallons and 4 pints. Write a script that defines this volume in gallons and pints and converts it to liters. Problem 2 Download the following Excel file: Link to File a This file contains 2 columns, we want to use these values to create a plot (remember to separate into separate figures) The first column contains the x values, the second column contains the y values. 1. Import the excel file into MATLAB. 2. Separate the 2 columns out into two new vectors. 3. Create a plot of the 2 vectors with the following options. 1. Grid on. 2 Black dashed line 3. Title should be "Y = X^2" 4. X-axis should be labeled "X axis" 5. Y-axis should be labeled "Y-axis" 4. Create a second plot, but this time use the data directly from the original matrix. That is, refer to each column directly as a vector (think subarrays) when you enter the x and y vectors in the plot command. 5. Into variable min1, assign the minimum value of y into this (you must use one of the built-in MATLAB functions to do this
Step by Step Solution
There are 3 Steps involved in it

Get step-by-step solutions from verified subject matter experts