

Question: Please solve problem 3 and 4 using matlab and include the screenshot of the code , thank you 236-element gray colormap. 3. Again, open the
Please solve problem 3 and 4 using matlab and include the screenshot of the code , thank you
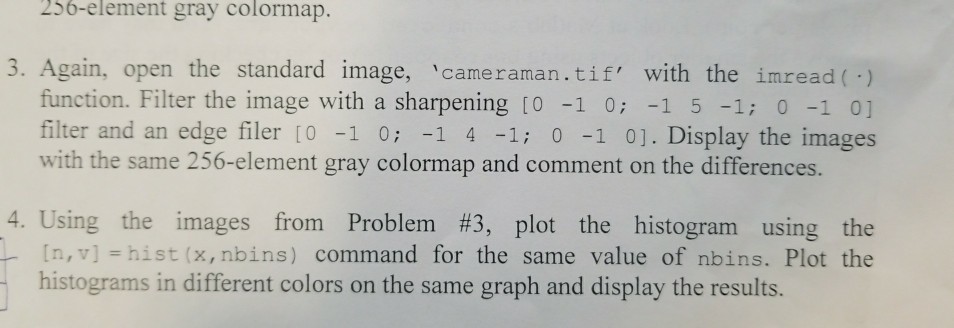
236-element gray colormap. 3. Again, open the standard image, 'cameraman.tif' with the imread) function. Filter the image with a sharpening [0 -1 0; -1 5 -1; 0 -1 0] filter and an edge filer tO -1 0; -1 4 -1 0 -1 0]. Display the images with the same 256-element gray colormap and comment on the differences. 4. Using the images from Problem #3, plot the histogram using the In, v] -hist(x,nbins) command for the same value of nbins. Plot the histograms in different colors on the same graph and display the results
Step by Step Solution
There are 3 Steps involved in it
1 Expert Approved Answer
Step: 1 Unlock

Question Has Been Solved by an Expert!
Get step-by-step solutions from verified subject matter experts
Step: 2 Unlock
Step: 3 Unlock