

Question: Please solve problem 6.8 which is same as problem 6.3 but we have to solve in s chart 3. The data shown in Table 6E.3
Please solve problem 6.8 which is same as problem 6.3 but we have to solve in s chart 
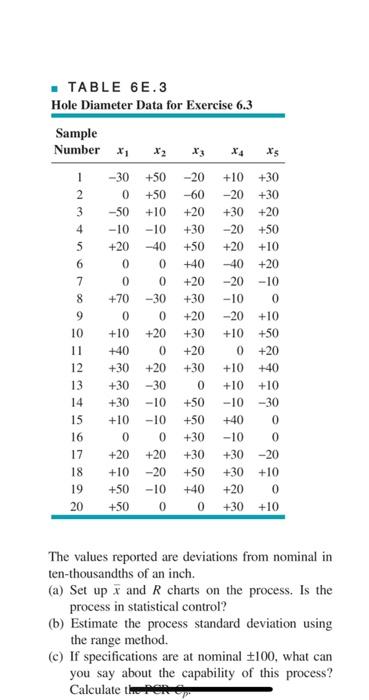
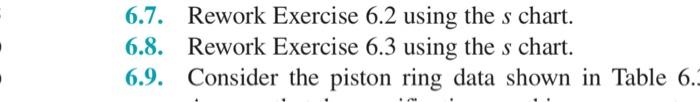
3. The data shown in Table 6E.3 are the deviations from nominal diameter for holes drilled in a carbon-fiber composite material used in aerospace manufacturing. The values reported are deviations from nominal in ten-thousandths of an inch. (a) Set up x and R charts on the process. Is the process in statistical control? (b) Estimate the process standard deviation using the range method. (c) If specifications are at nominal 100, what can you say about the capability of this process? Calculate thosen-cyp 6.7. Rework Exercise 6.2 using the s chart. 6.8. Rework Exercise 6.3 using the s chart. 6.9. Consider the piston ring data shown in Table 6 Step by Step Solution
There are 3 Steps involved in it
1 Expert Approved Answer
Step: 1 Unlock

Question Has Been Solved by an Expert!
Get step-by-step solutions from verified subject matter experts
Step: 2 Unlock
Step: 3 Unlock