

Question: PLEASE SOLVE QUESTION D AND Required information [The following information applies to the questions displayed below.] Crispin Company's sales from last year were $8 million.
PLEASE SOLVE QUESTION D AND
![the questions displayed below.] Crispin Company's sales from last year were $8](https://s3.amazonaws.com/si.experts.images/answers/2024/09/66e140bfad3cf_20766e140bf13a39.jpg)
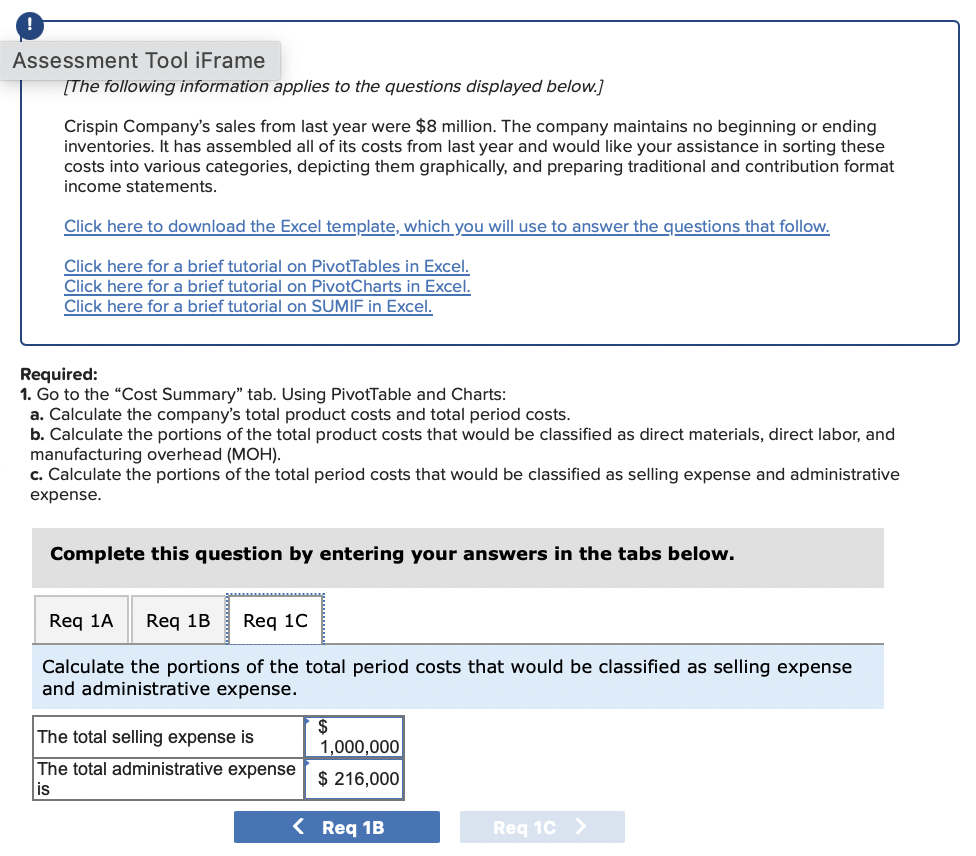
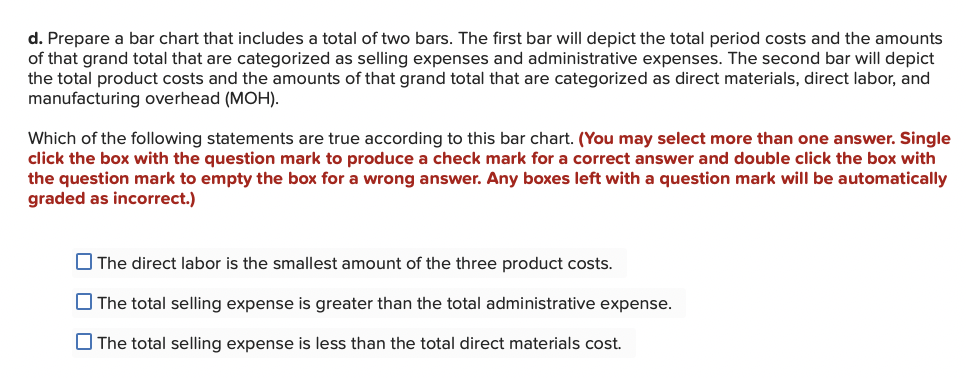
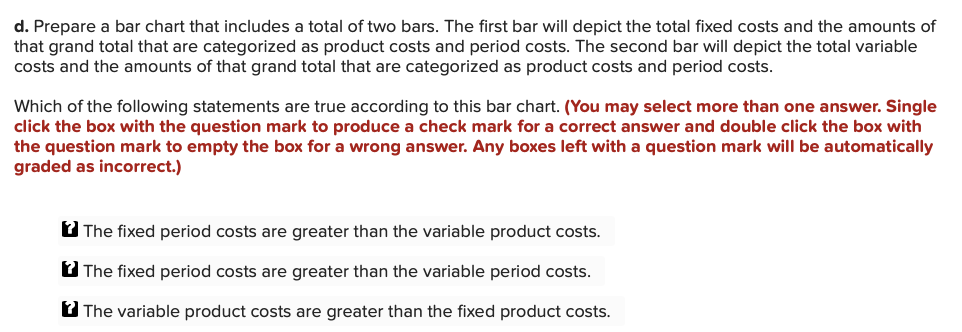
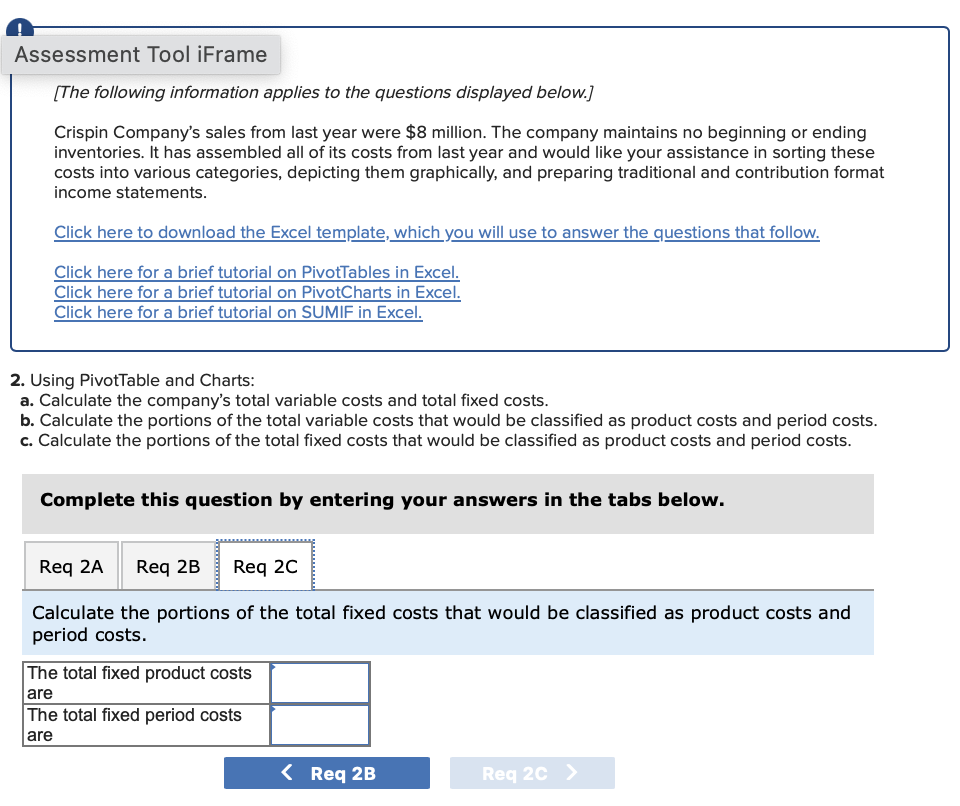
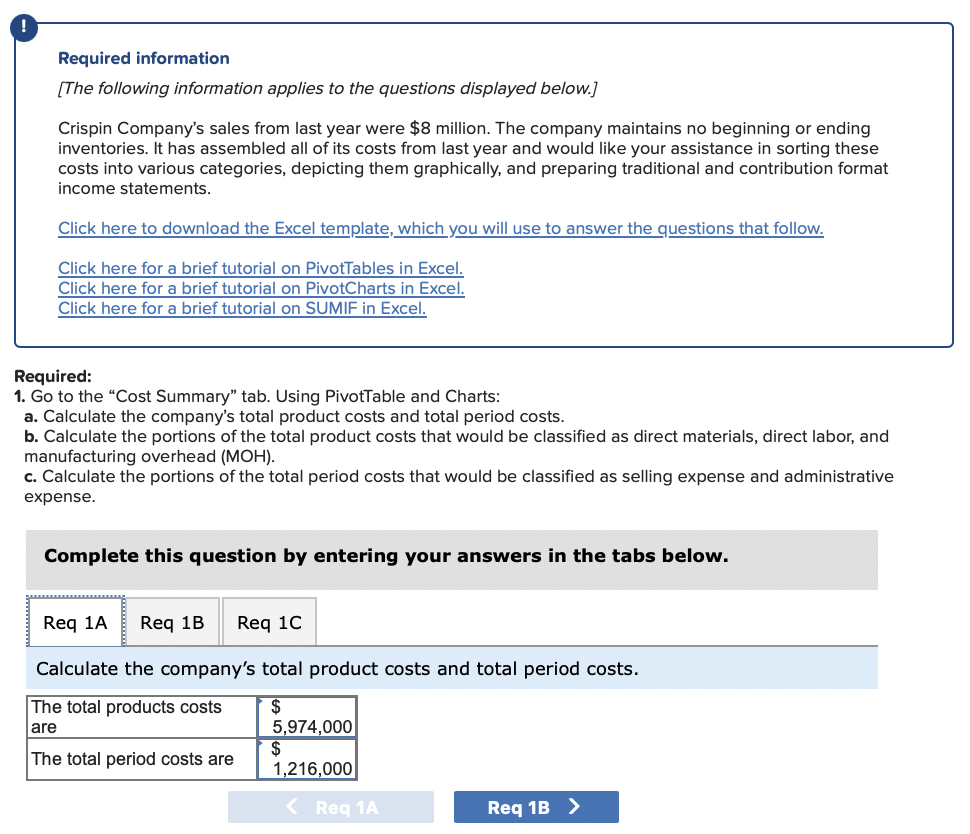
Required information [The following information applies to the questions displayed below.] Crispin Company's sales from last year were $8 million. The company maintains no beginning or ending inventories. It has assembled all of its costs from last year and would like your assistance in sorting these costs into various categories, depicting them graphically, and preparing traditional and contribution format income statements. Click here to download the Excel template, which you will use to answer the questions that follow. Click here for a brief tutorial on PivotTables in Excel. Click here for a brief tutorial on PivotCharts in Excel. Click here for a brief tutorial on SUMIF in Excel. Required: 1. Go to the "Cost Summary" tab. Using PivotTable and Charts: a. Calculate the company's total product costs and total period costs. b. Calculate the portions of the total product costs that would be classified as direct materials, direct labor, and manufacturing overhead (MOH). c. Calculate the portions of the total period costs that would be classified as selling expense and administrative expense. Complete this question by entering your answers in the tabs below. Calculate the company's total product costs and total period costs. Assessment Tool iFrame Crispin Company's sales from last year were \$8 million. The company maintains no beginning or ending inventories. It has assembled all of its costs from last year and would like your assistance in sorting these costs into various categories, depicting them graphically, and preparing traditional and contribution format income statements. Click here to download the Excel template, which you will use to answer the questions that follow. Click here for a brief tutorial on PivotTables in Excel. Click here for a brief tutorial on PivotCharts in Excel. Click here for a brief tutorial on SUMIF in Excel. Required: 1. Go to the "Cost Summary" tab. Using PivotTable and Charts: a. Calculate the company's total product costs and total period costs. b. Calculate the portions of the total product costs that would be classified as direct materials, direct labor, and manufacturing overhead (MOH). c. Calculate the portions of the total period costs that would be classified as selling expense and administrative expense. Complete this question by entering your answers in the tabs below. Calculate the portions of the total product costs that would be classified as direct materials, direct labor, and manufacturing overhead (MOH). Assessment Tool iFrame [The following information applies to the questions displayed below.] Crispin Company's sales from last year were \$8 million. The company maintains no beginning or ending inventories. It has assembled all of its costs from last year and would like your assistance in sorting these costs into various categories, depicting them graphically, and preparing traditional and contribution format income statements. Click here to download the Excel template, which you will use to answer the questions that follow. Click here for a brief tutorial on PivotTables in Excel. Click here for a brief tutorial on PivotCharts in Excel. Click here for a brief tutorial on SUMIF in Excel. Required: 1. Go to the "Cost Summary" tab. Using PivotTable and Charts: a. Calculate the company's total product costs and total period costs. b. Calculate the portions of the total product costs that would be classified as direct materials, direct labor, and manufacturing overhead (MOH). c. Calculate the portions of the total period costs that would be classified as selling expense and administrative expense. Complete this question by entering your answers in the tabs below. Calculate the portions of the total period costs that would be classified as selling expense and administrative expense. d. Prepare a bar chart that includes a total of two bars. The first bar will depict the total period costs and the amounts of that grand total that are categorized as selling expenses and administrative expenses. The second bar will depict the total product costs and the amounts of that grand total that are categorized as direct materials, direct labor, and manufacturing overhead (MOH). Which of the following statements are true according to this bar chart. (You may select more than one answer. Single click the box with the question mark to produce a check mark for a correct answer and double click the box with the question mark to empty the box for a wrong answer. Any boxes left with a question mark will be automatically graded as incorrect.) The direct labor is the smallest amount of the three product costs. The total selling expense is greater than the total administrative expense. The total selling expense is less than the total direct materials cost. d. Prepare a bar chart that includes a total of two bars. The first bar will depict the total fixed costs and the amounts of that grand total that are categorized as product costs and period costs. The second bar will depict the total variable costs and the amounts of that grand total that are categorized as product costs and period costs. Which of the following statements are true according to this bar chart. (You may select more than one answer. Single click the box with the question mark to produce a check mark for a correct answer and double click the box with the question mark to empty the box for a wrong answer. Any boxes left with a question mark will be automatically graded as incorrect.) U The fixed period costs are greater than the variable product costs. U The fixed period costs are greater than the variable period costs. U The variable product costs are greater than the fixed product costs. [The following information applies to the questions displayed below.] Crispin Company's sales from last year were $8 million. The company maintains no beginning or ending inventories. It has assembled all of its costs from last year and would like your assistance in sorting these costs into various categories, depicting them graphically, and preparing traditional and contribution format income statements. Click here to download the Excel template, which you will use to answer the questions that follow. Click here for a brief tutorial on PivotTables in Excel. Click here for a brief tutorial on PivotCharts in Excel. Click here for a brief tutorial on SUMIF in Excel. Using PivotTable and Charts: a. Calculate the company's total variable costs and total fixed costs. b. Calculate the portions of the total variable costs that would be classified as product costs and period costs. c. Calculate the portions of the total fixed costs that would be classified as product costs and period costs. Complete this question by entering your answers in the tabs below. Calculate the portions of the total fixed costs that would be classified as product costs and period costs. Required information [The following information applies to the questions displayed below.] Crispin Company's sales from last year were $8 million. The company maintains no beginning or ending inventories. It has assembled all of its costs from last year and would like your assistance in sorting these costs into various categories, depicting them graphically, and preparing traditional and contribution format income statements. Click here to download the Excel template, which you will use to answer the questions that follow. Click here for a brief tutorial on PivotTables in Excel. Click here for a brief tutorial on PivotCharts in Excel. Click here for a brief tutorial on SUMIF in Excel. Required: 1. Go to the "Cost Summary" tab. Using PivotTable and Charts: a. Calculate the company's total product costs and total period costs. b. Calculate the portions of the total product costs that would be classified as direct materials, direct labor, and manufacturing overhead (MOH). c. Calculate the portions of the total period costs that would be classified as selling expense and administrative expense. Complete this question by entering your answers in the tabs below. Calculate the company's total product costs and total period costs. Assessment Tool iFrame Crispin Company's sales from last year were \$8 million. The company maintains no beginning or ending inventories. It has assembled all of its costs from last year and would like your assistance in sorting these costs into various categories, depicting them graphically, and preparing traditional and contribution format income statements. Click here to download the Excel template, which you will use to answer the questions that follow. Click here for a brief tutorial on PivotTables in Excel. Click here for a brief tutorial on PivotCharts in Excel. Click here for a brief tutorial on SUMIF in Excel. Required: 1. Go to the "Cost Summary" tab. Using PivotTable and Charts: a. Calculate the company's total product costs and total period costs. b. Calculate the portions of the total product costs that would be classified as direct materials, direct labor, and manufacturing overhead (MOH). c. Calculate the portions of the total period costs that would be classified as selling expense and administrative expense. Complete this question by entering your answers in the tabs below. Calculate the portions of the total product costs that would be classified as direct materials, direct labor, and manufacturing overhead (MOH). Assessment Tool iFrame [The following information applies to the questions displayed below.] Crispin Company's sales from last year were \$8 million. The company maintains no beginning or ending inventories. It has assembled all of its costs from last year and would like your assistance in sorting these costs into various categories, depicting them graphically, and preparing traditional and contribution format income statements. Click here to download the Excel template, which you will use to answer the questions that follow. Click here for a brief tutorial on PivotTables in Excel. Click here for a brief tutorial on PivotCharts in Excel. Click here for a brief tutorial on SUMIF in Excel. Required: 1. Go to the "Cost Summary" tab. Using PivotTable and Charts: a. Calculate the company's total product costs and total period costs. b. Calculate the portions of the total product costs that would be classified as direct materials, direct labor, and manufacturing overhead (MOH). c. Calculate the portions of the total period costs that would be classified as selling expense and administrative expense. Complete this question by entering your answers in the tabs below. Calculate the portions of the total period costs that would be classified as selling expense and administrative expense. d. Prepare a bar chart that includes a total of two bars. The first bar will depict the total period costs and the amounts of that grand total that are categorized as selling expenses and administrative expenses. The second bar will depict the total product costs and the amounts of that grand total that are categorized as direct materials, direct labor, and manufacturing overhead (MOH). Which of the following statements are true according to this bar chart. (You may select more than one answer. Single click the box with the question mark to produce a check mark for a correct answer and double click the box with the question mark to empty the box for a wrong answer. Any boxes left with a question mark will be automatically graded as incorrect.) The direct labor is the smallest amount of the three product costs. The total selling expense is greater than the total administrative expense. The total selling expense is less than the total direct materials cost. d. Prepare a bar chart that includes a total of two bars. The first bar will depict the total fixed costs and the amounts of that grand total that are categorized as product costs and period costs. The second bar will depict the total variable costs and the amounts of that grand total that are categorized as product costs and period costs. Which of the following statements are true according to this bar chart. (You may select more than one answer. Single click the box with the question mark to produce a check mark for a correct answer and double click the box with the question mark to empty the box for a wrong answer. Any boxes left with a question mark will be automatically graded as incorrect.) U The fixed period costs are greater than the variable product costs. U The fixed period costs are greater than the variable period costs. U The variable product costs are greater than the fixed product costs. [The following information applies to the questions displayed below.] Crispin Company's sales from last year were $8 million. The company maintains no beginning or ending inventories. It has assembled all of its costs from last year and would like your assistance in sorting these costs into various categories, depicting them graphically, and preparing traditional and contribution format income statements. Click here to download the Excel template, which you will use to answer the questions that follow. Click here for a brief tutorial on PivotTables in Excel. Click here for a brief tutorial on PivotCharts in Excel. Click here for a brief tutorial on SUMIF in Excel. Using PivotTable and Charts: a. Calculate the company's total variable costs and total fixed costs. b. Calculate the portions of the total variable costs that would be classified as product costs and period costs. c. Calculate the portions of the total fixed costs that would be classified as product costs and period costs. Complete this question by entering your answers in the tabs below. Calculate the portions of the total fixed costs that would be classified as product costs and period costs
Step by Step Solution
There are 3 Steps involved in it

Get step-by-step solutions from verified subject matter experts