

Question: please solve questions with the excel data sheet Monstermash, an online game app development company, has built a predictive model to identify gamers who are
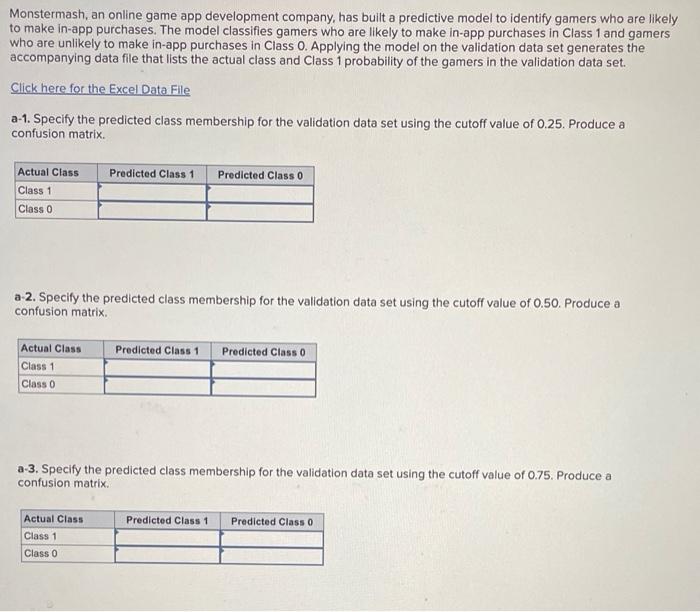
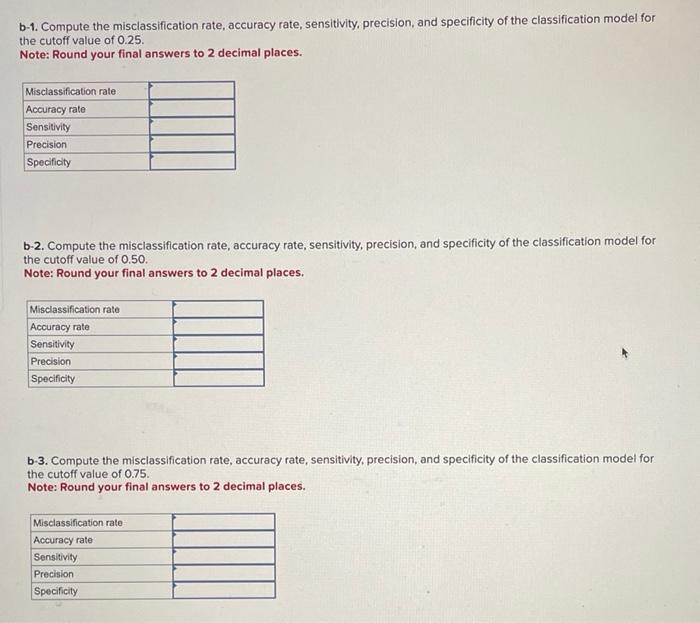
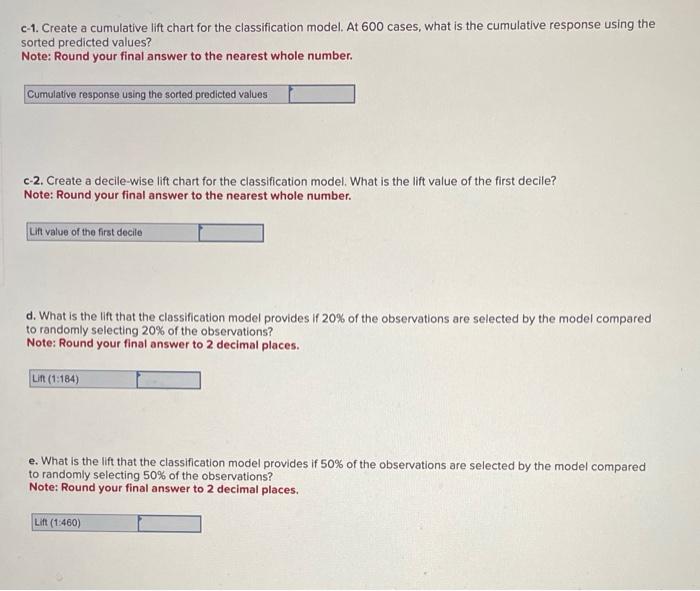
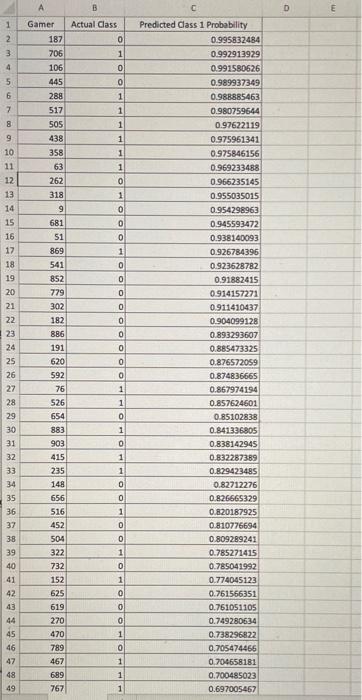
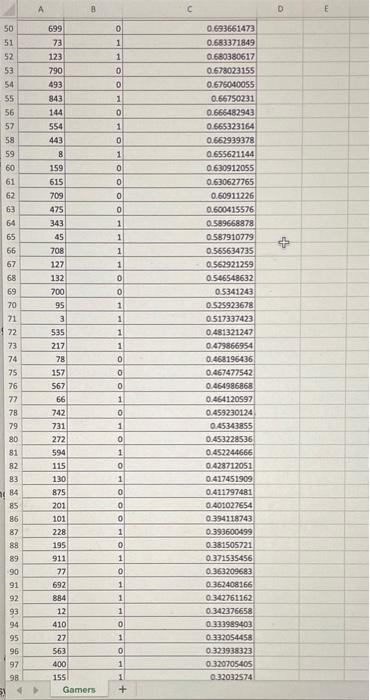
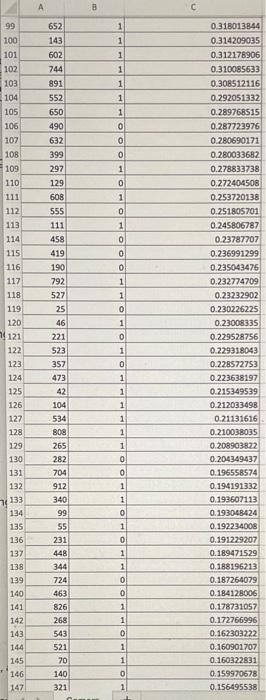
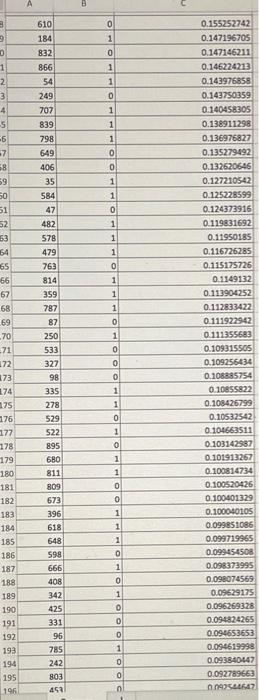
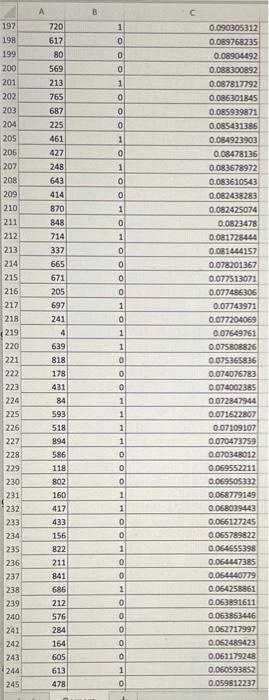
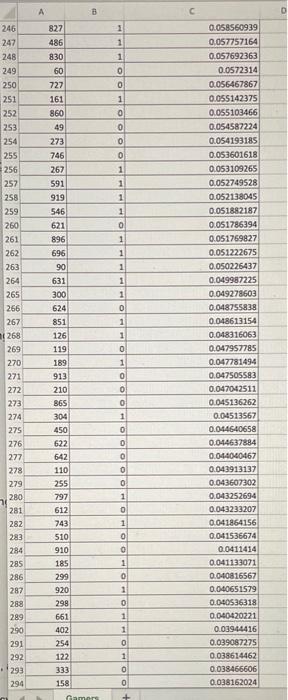
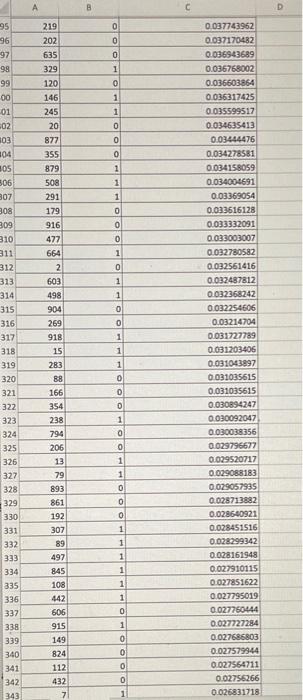
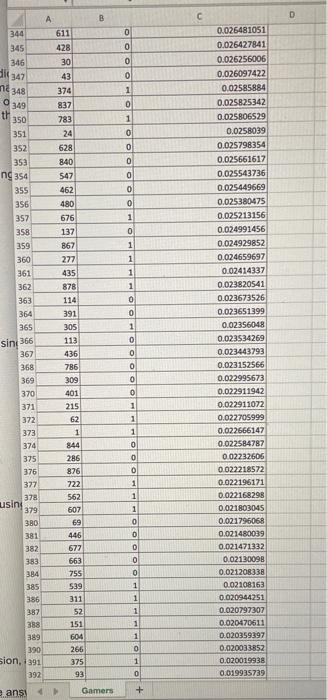
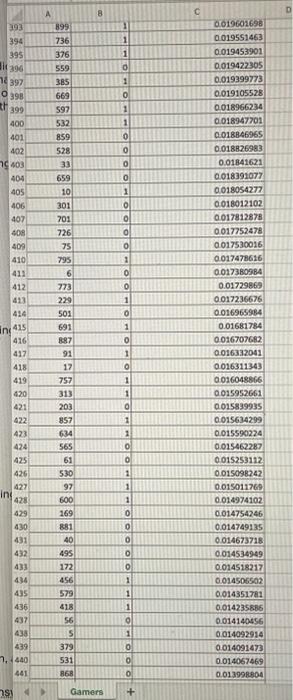
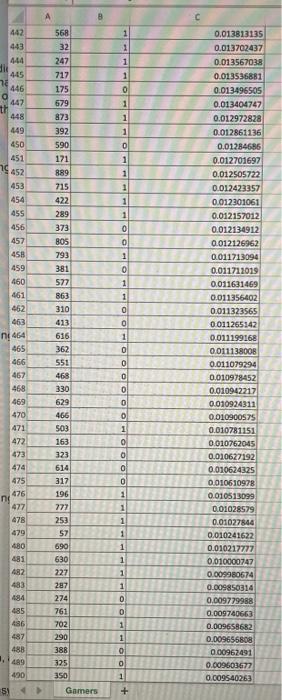
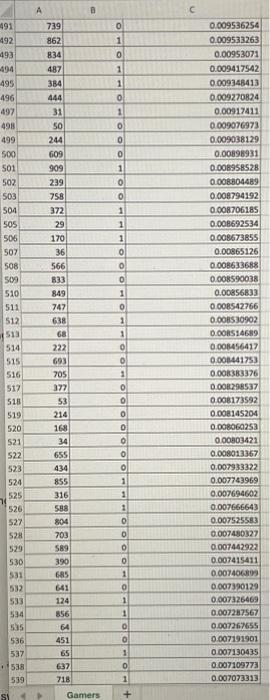
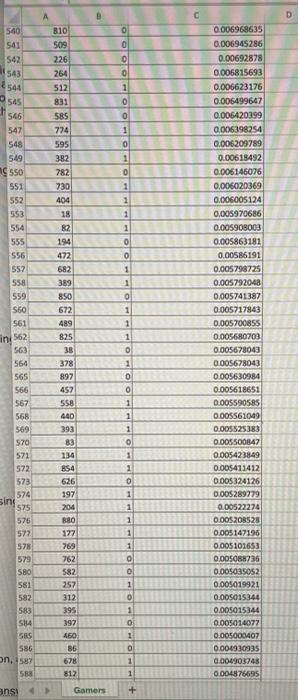
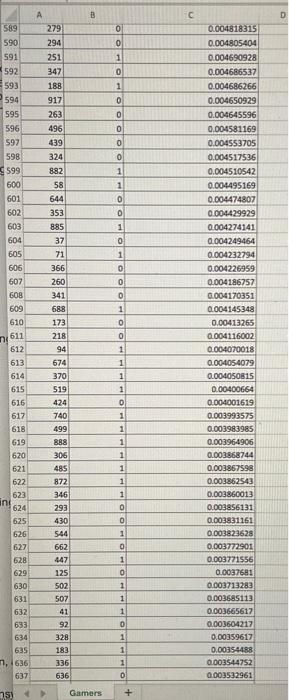
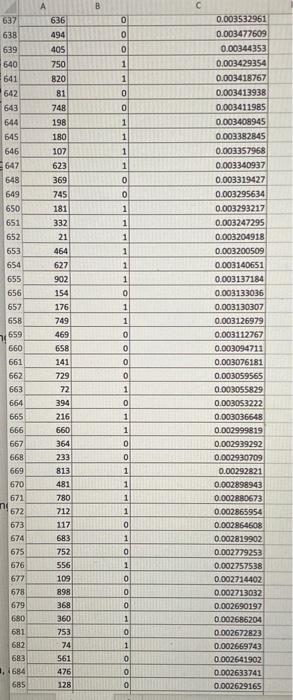
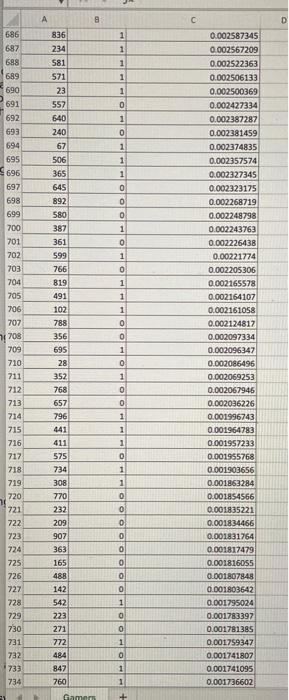
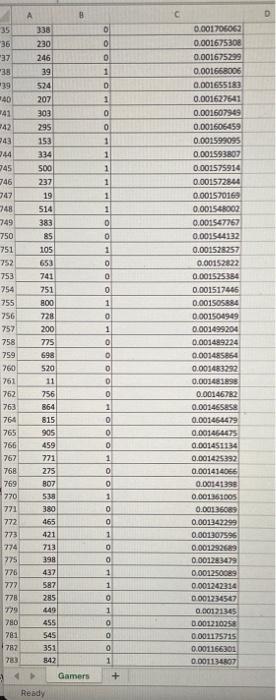
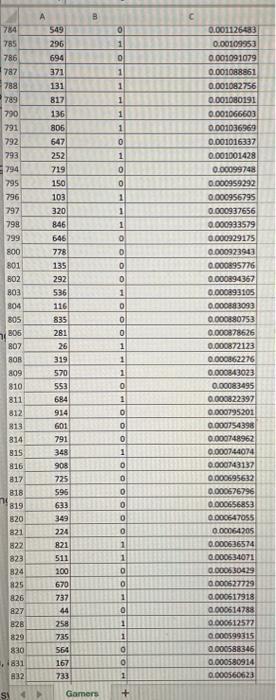
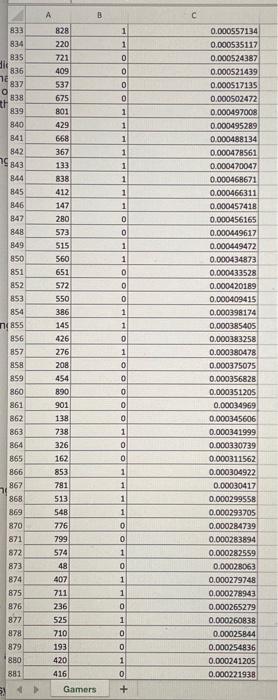
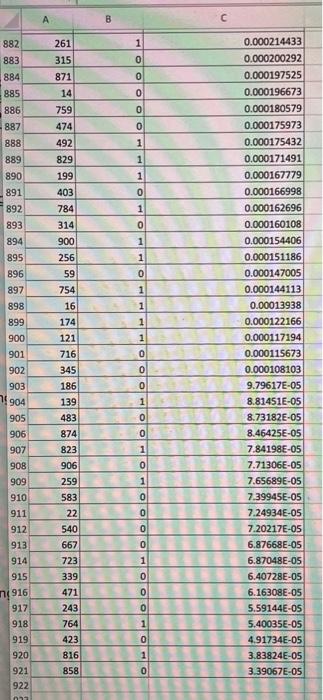
Monstermash, an online game app development company, has built a predictive model to identify gamers who are likely to make in-app purchases. The model classifies gamers who are likely to make in-app purchases in Class 1 and gamers who are unlikely to make in-app purchases in Class 0 . Applying the model on the validation data set generates the accompanying data file that lists the actual class and Class 1 probability of the gamers in the validation data set. Click here for the Excel Data File a-1. Specify the predicted class membership for the validation data set using the cutoff value of 0.25. Produce a confusion matrix. a-2. Specify the predicted class membership for the validation data set using the cutoff value of 0.50. Produce a confusion matrix. a-3. Specify the predicted class membership for the validation data set using the cutoff value of 0.75. Produce a confusion matrix. b-1. Compute the misclassification rate, accuracy rate, sensitivity, precision, and specificity of the classification model for the cutoff value of 0.25. Note: Round your final answers to 2 decimal places. b-2. Compute the misclassification rate, accuracy rate, sensitivity, precision, and specificity of the classification model for the cutoff value of 0.50. Note: Round your final answers to 2 decimal places. b-3. Compute the misclassification rate, accuracy rate, sensitivity, precision, and specificity of the classification model for the cutoff value of 0.75. Note: Round your final answers to 2 decimal places. c-1. Create a cumulative lift chart for the classification model. At 600 cases, what is the cumulative response using the sorted predicted values? Note: Round your final answer to the nearest whole number. c-2. Create a decile-wise lift chart for the classification model. What is the lift value of the first decile? Note: Round your final answer to the nearest whole number. d. What is the lift that the classification model provides if 20% of the observations are selected by the model compared to randomly selecting 20% of the observations? Note: Round your final answer to 2 decimal places. e. What is the lift that the classification model provides if 50% of the observations are selected by the model compared to randomly selecting 50% of the observations? Note: Round your final answer to 2 decimal places. Monstermash, an online game app development company, has built a predictive model to identify gamers who are likely to make in-app purchases. The model classifies gamers who are likely to make in-app purchases in Class 1 and gamers who are unlikely to make in-app purchases in Class 0 . Applying the model on the validation data set generates the accompanying data file that lists the actual class and Class 1 probability of the gamers in the validation data set. Click here for the Excel Data File a-1. Specify the predicted class membership for the validation data set using the cutoff value of 0.25. Produce a confusion matrix. a-2. Specify the predicted class membership for the validation data set using the cutoff value of 0.50. Produce a confusion matrix. a-3. Specify the predicted class membership for the validation data set using the cutoff value of 0.75. Produce a confusion matrix. b-1. Compute the misclassification rate, accuracy rate, sensitivity, precision, and specificity of the classification model for the cutoff value of 0.25. Note: Round your final answers to 2 decimal places. b-2. Compute the misclassification rate, accuracy rate, sensitivity, precision, and specificity of the classification model for the cutoff value of 0.50. Note: Round your final answers to 2 decimal places. b-3. Compute the misclassification rate, accuracy rate, sensitivity, precision, and specificity of the classification model for the cutoff value of 0.75. Note: Round your final answers to 2 decimal places. c-1. Create a cumulative lift chart for the classification model. At 600 cases, what is the cumulative response using the sorted predicted values? Note: Round your final answer to the nearest whole number. c-2. Create a decile-wise lift chart for the classification model. What is the lift value of the first decile? Note: Round your final answer to the nearest whole number. d. What is the lift that the classification model provides if 20% of the observations are selected by the model compared to randomly selecting 20% of the observations? Note: Round your final answer to 2 decimal places. e. What is the lift that the classification model provides if 50% of the observations are selected by the model compared to randomly selecting 50% of the observations? Note: Round your final answer to 2 decimal places
Step by Step Solution
There are 3 Steps involved in it

Get step-by-step solutions from verified subject matter experts