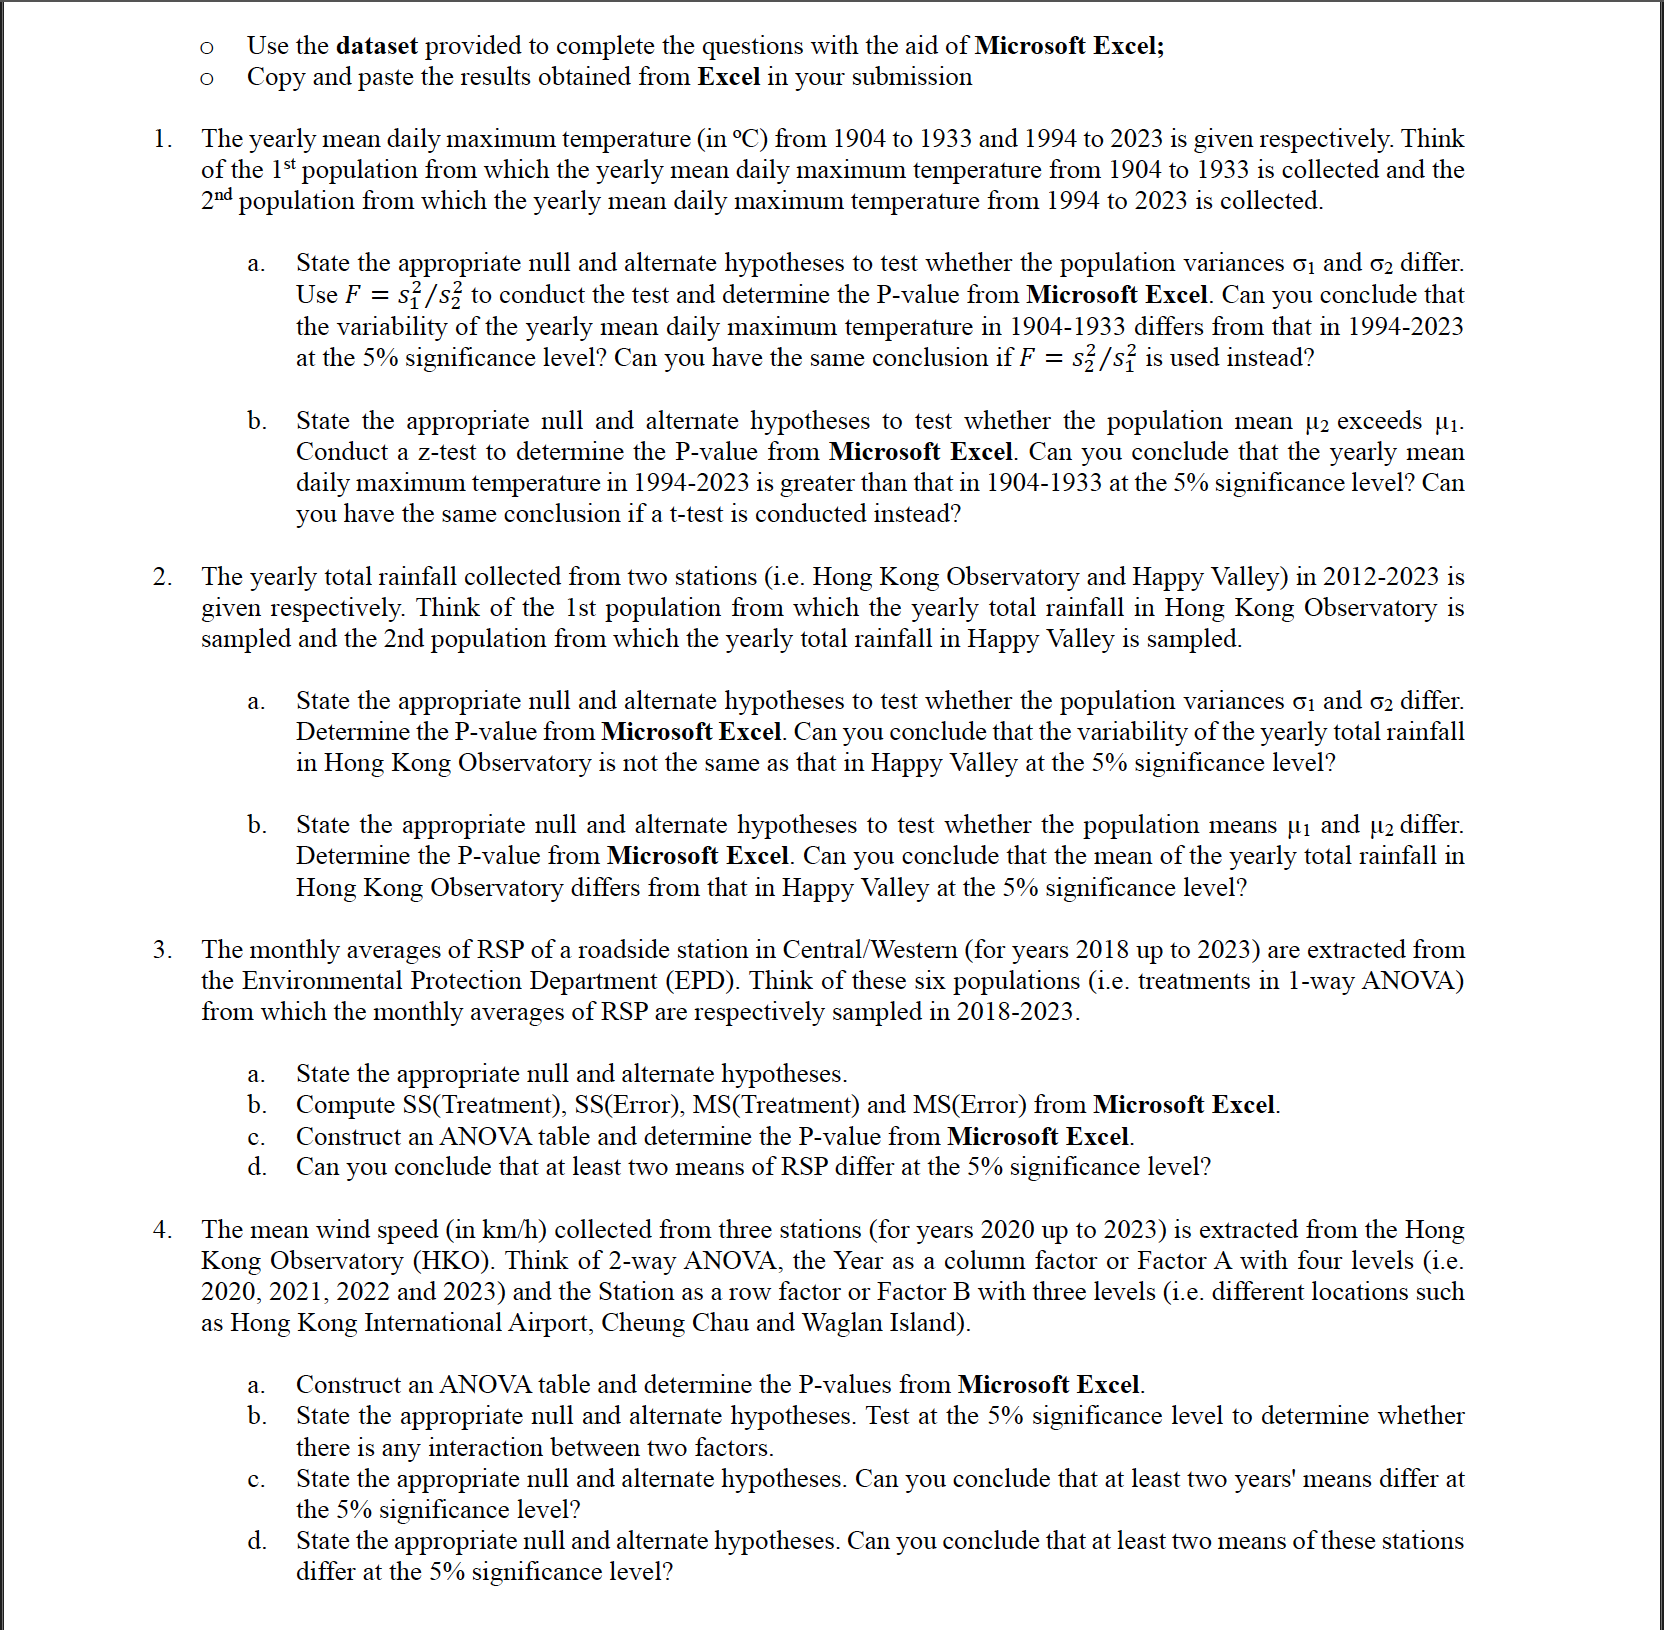
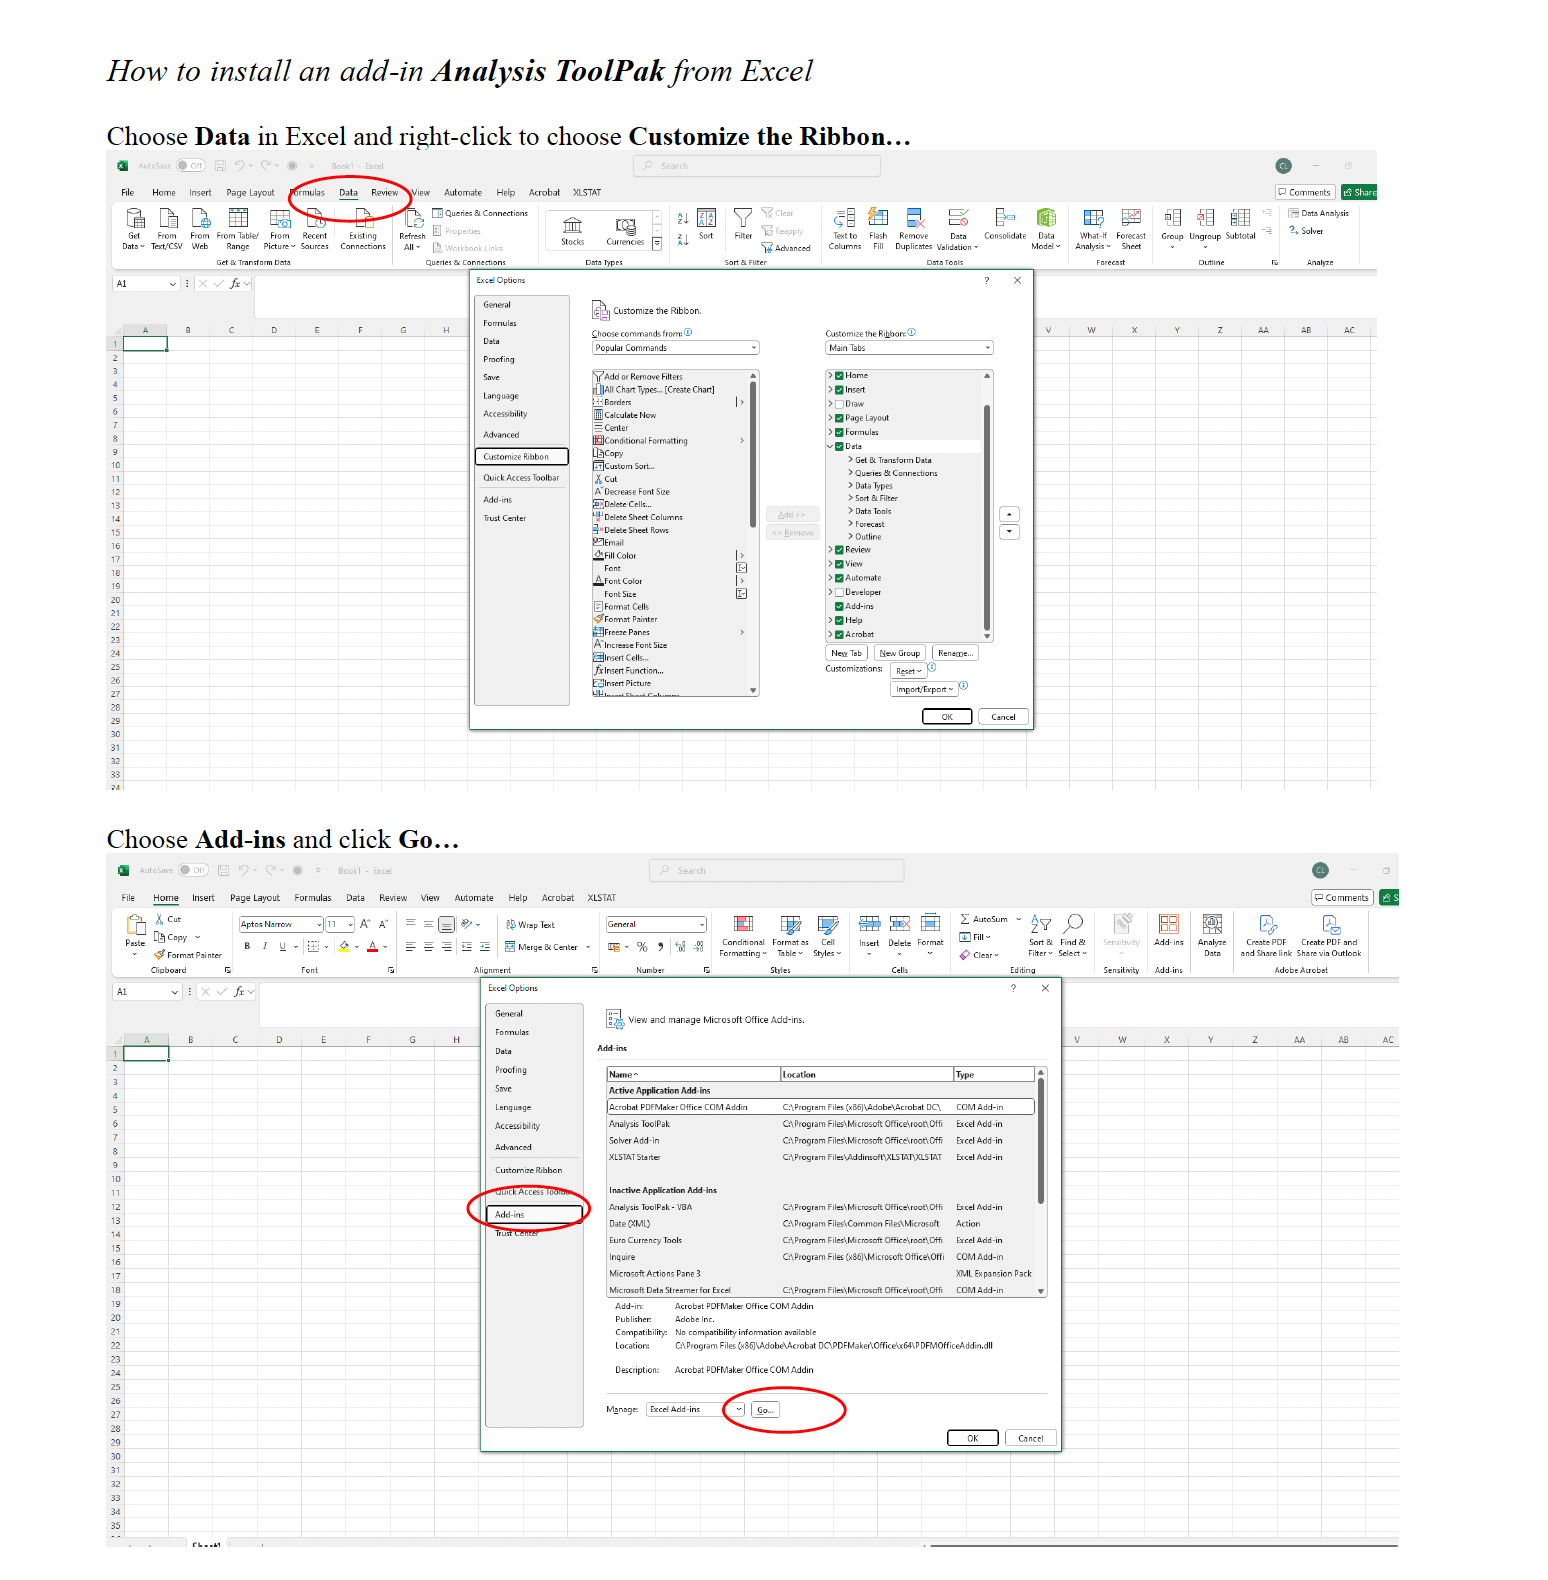
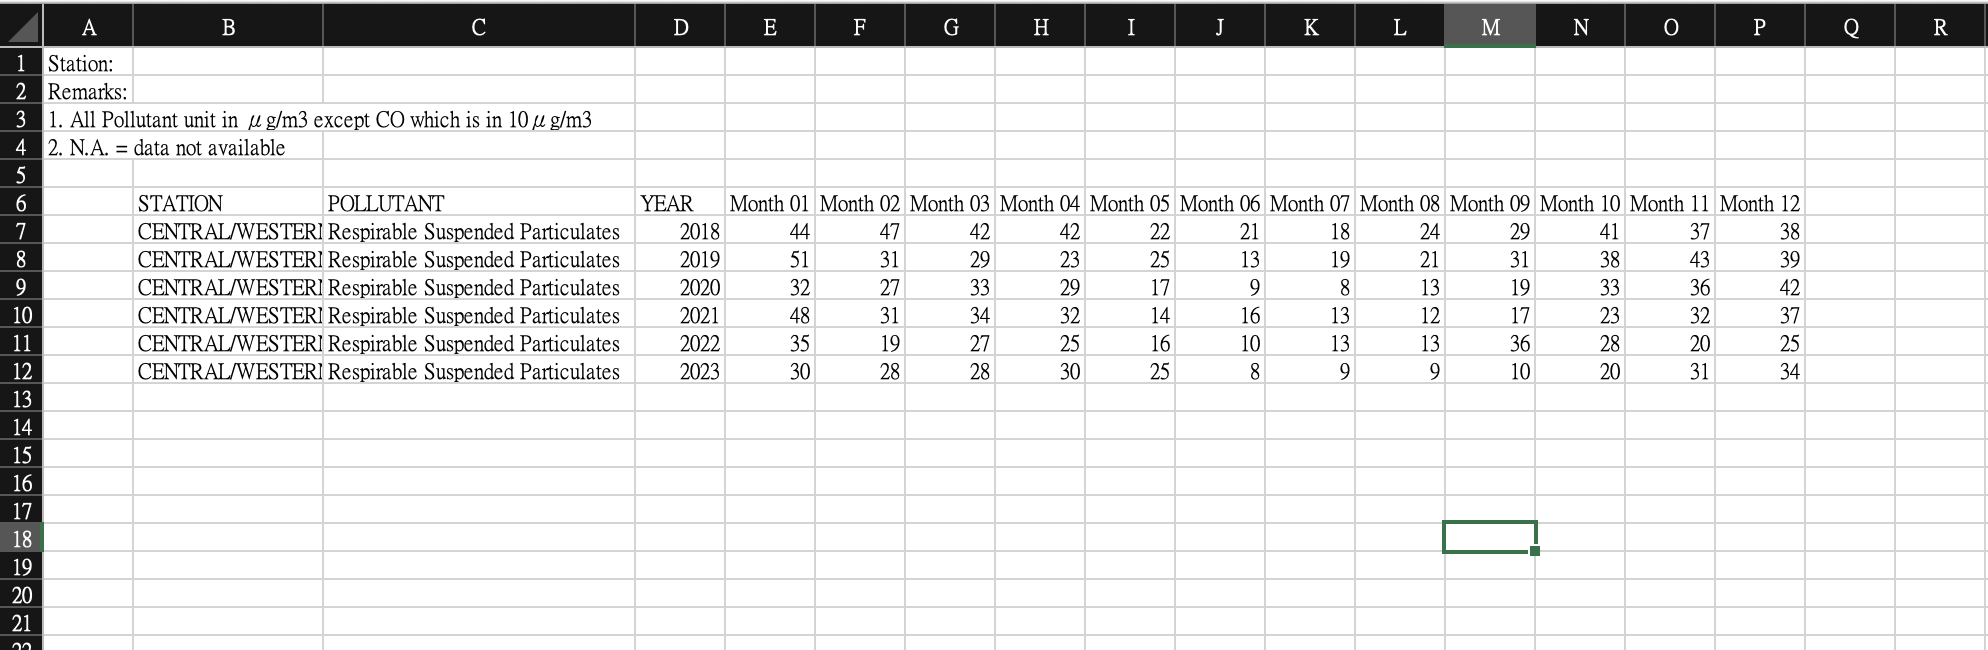
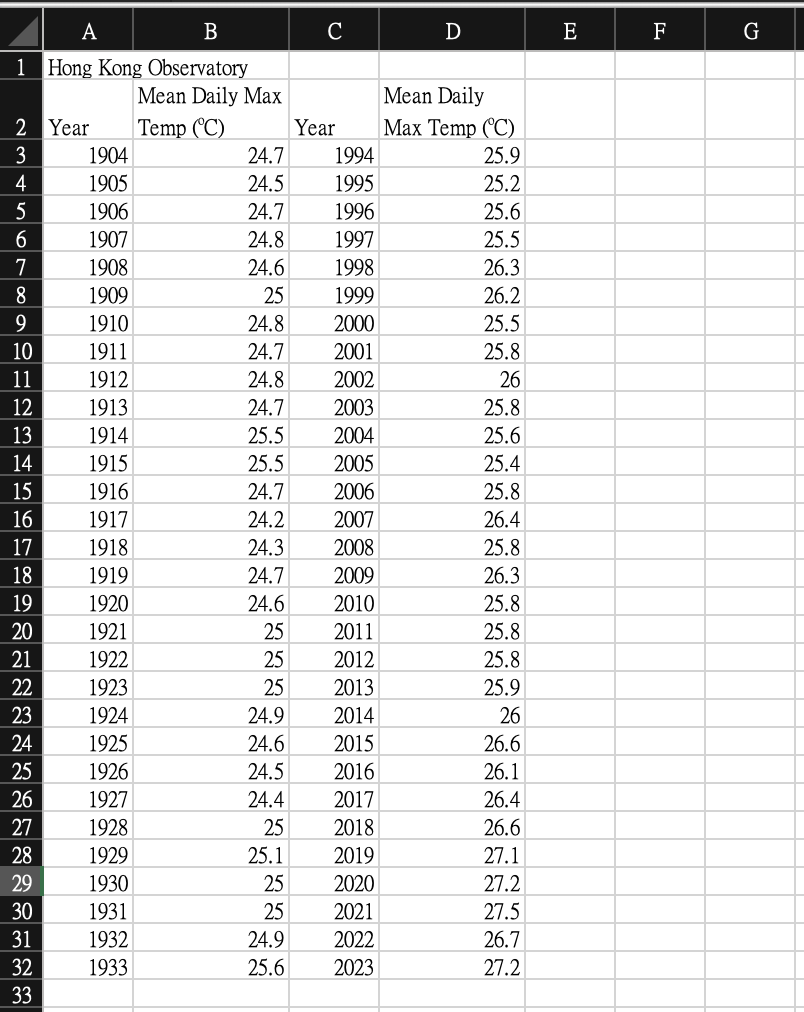
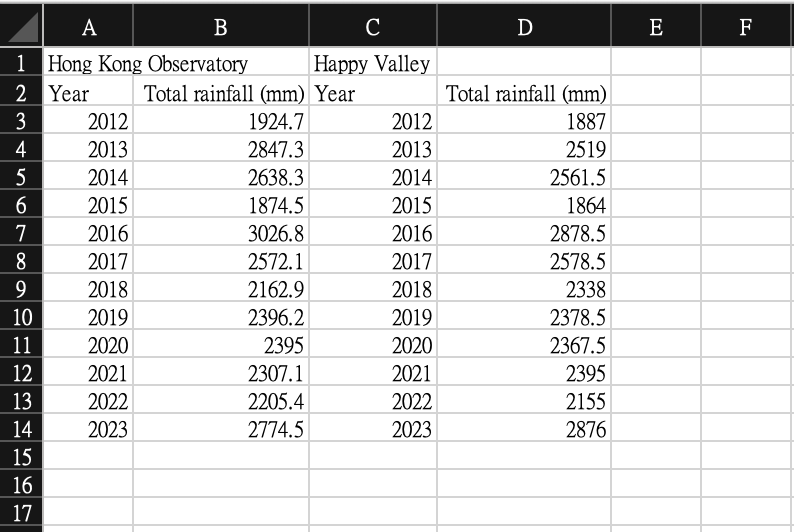
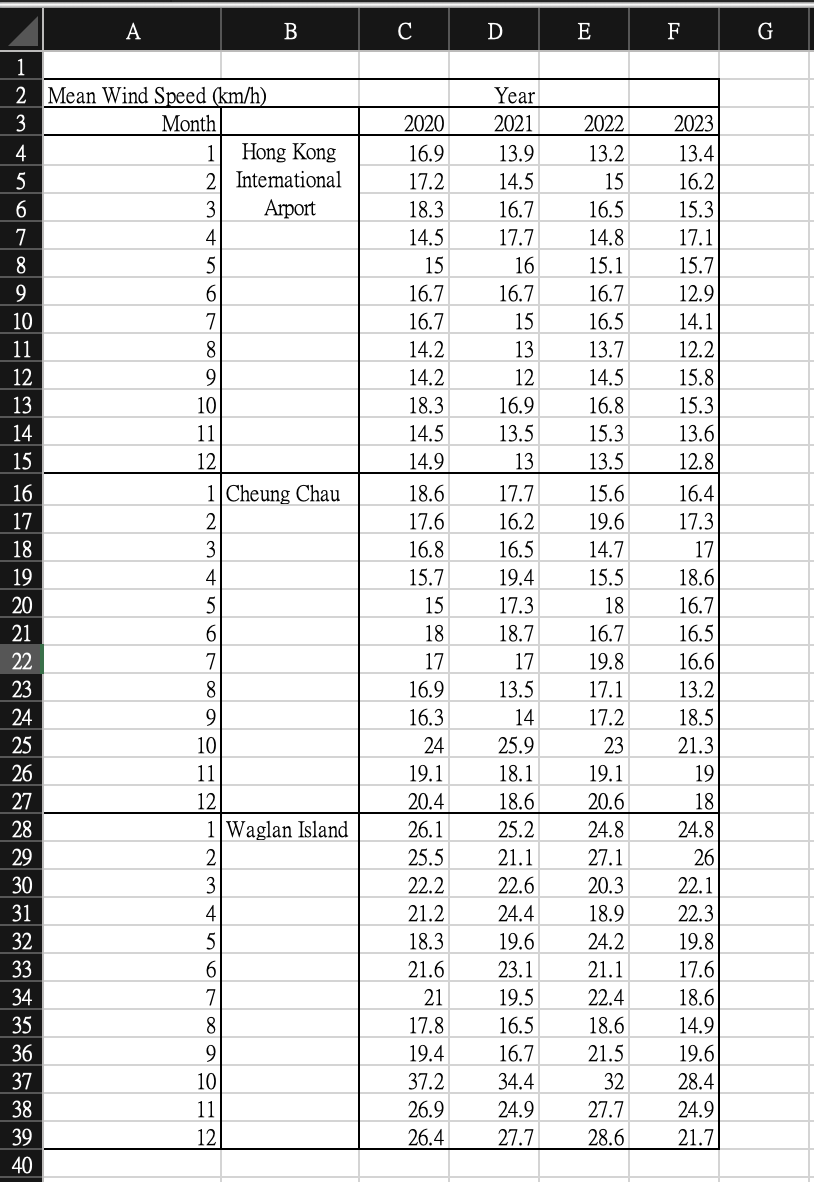
Question: please solve step by step o Use the dataset provided to complete the questions with the aid of Microsoft Excel; o Copy and paste the

please solve step by step

please solve step by step o Use the datasetplease solve step by step o Use the datasetplease solve step by step o Use the datasetplease solve step by step o Use the datasetplease solve step by step o Use the datasetplease solve step by step o Use the dataset
o Use the dataset provided to complete the questions with the aid of Microsoft Excel; o Copy and paste the results obtained from Excel in your submission 1. The yearly mean daily maximum temperature (in C) from 1904 to 1933 and 1994 to 2023 is given respectively. Think of the 1% population from which the yearly mean daily maximum temperature from 1904 to 1933 is collected and the 284 population from which the yearly mean daily maximum temperature from 1994 to 2023 is collected. a. State the appropriate null and alternate hypotheses to test whether the population variances 6; and o5 differ. Use F = s2 /52 to conduct the test and determine the P-value from Microsoft Excel. Can you conclude that the variability of the yearly mean daily maxmmum temperature in 1904-1933 differs from that in 1994-2023 at the 5% significance level? Can you have the same conclusion if F = s2 /57 is used instead? b. State the appropriate null and alternate hypotheses to test whether the population mean p2 exceeds . Conduct a z-test to determine the P-value from Microsoft Excel. Can you conclude that the yearly mean daily maximum temperature in 1994-2023 is greater than that in 1904-1933 at the 5% significance level? Can you have the same conclusion if a t-test 1s conducted instead? 2. The yearly total rainfall collected from two stations (i.e. Hong Kong Observatory and Happy Valley) in 2012-2023 is given respectively. Think of the 1st population from which the yearly total rainfall in Hong Kong Observatory is sampled and the 2nd population from which the yearly total rainfall in Happy Valley is sampled. a. State the appropriate null and alternate hypotheses to test whether the population variances 61 and o2 differ. Determine the P-value from Microsoft Excel. Can you conclude that the variability of the yearly total rainfall in Hong Kong Observatory is not the same as that in Happy Valley at the 5% significance level? b. State the appropriate null and alternate hypotheses to test whether the population means p; and p differ. Determine the P-value from Microsoft Excel. Can you conclude that the mean of the yearly total rainfall in Hong Kong Observatory differs from that in Happy Valley at the 5% significance level? 3. The monthly averages of RSP of a roadside station in Central/Western (for years 2018 up to 2023) are extracted from the Environmental Protection Department (EPD). Think of these six populations (1.e. treatments in 1-way ANOVA) from which the monthly averages of RSP are respectively sampled in 2018-2023. State the appropriate null and alternate hypotheses. Compute SS(Treatment), SS(Error), MS(Treatment) and MS(Error) from Microsoft Excel. Construct an ANOVA table and determine the P-value from Microsoft Excel. Can you conclude that at least two means of RSP differ at the 5% significance level? Ao o 4. The mean wind speed (in km/h) collected from three stations (for years 2020 up to 2023) is extracted from the Hong Kong Observatory (HKO). Think of 2-way ANOVA, the Year as a column factor or Factor A with four levels (i.e. 2020, 2021, 2022 and 2023) and the Station as a row factor or Factor B with three levels (1.e. different locations such as Hong Kong International Aurport, Cheung Chau and Waglan Island). a. Construct an ANOVA table and determine the P-values from Microsoft Excel. b. State the appropriate null and alternate hypotheses. Test at the 5% significance level to determine whether there 1s any interaction between two factors. c. State the appropriate null and alternate hypotheses. Can you conclude that at least two years' means differ at the 5% significance level? d. State the appropriate null and alternate hypotheses. Can you conclude that at least two means of these stations differ at the 5% significance level? How to install an add-in Analysis ToolPak from Excel Choose Data in Excel and right-click to choose Customize the Ribbon... AutoSave O off CL Home Insert Page Layout ormulas Data Review View Automate Help Acrobat XLSTAT Comments i's Share Queries & Connections Clear Data Analysis Get From From Frangele Picture* Sources Connections Refresh Properties Currencies , Respply 2, Solver Filter Actuaneed Coturns Fill Duplicates Validation nsolidate Data What. It Forecast Group Ungroup Subtotal Get & Transform Data Queries & Connections Data Types Data Tools Forecast outline Excel Options General Ey Customize the Ribbon. Formula choose commands from: D Customize the Ribbare @ AC Popular Commands Main Tabs T Add or Remove Filters Home Chart Types. [Create Chart] In Calculate No Draw Page Layout Advanced Conditional Formatting >Formulas Date Customize Ribbon If Custom Sort. > Get Bu Transform Data Quick Access Toolbar > Queries & Connection A Decrease Font Size >Data Types Add-ins Delete Cells.. rust Center Delete Sheet Column Add > > Delete Sheet Rows View A Font Cola >Automate Font SIZE > DevElope ElFormat Cells Add-ins > Help Freeze Panes >Acrobat insert cells News Tab New Group |Rename.. fix Insert Function Customizations Res Import/ Export ~j@ OK Cancel Choose Add-ins and click Go... Search ED File Home Insert Page Layout Formulas Data Review View Automate Help Acrobat XLSTAT Comments s & Cut Aptos Narrow - 17 .A A = = _ - 2 Wrap Text General Autosum ~ Ap J Paste Copy ~ BIY -B . A . A . BEE E Merge & Center LE - % " 3 - Formatting" Table Styles Insert Delete Format Fil - Find & ensitivity Add -ins A Format Painter and Share link Share via Outlook Clipboard Font Clear " Analyze Alignment Styles Editing Sensitivity Add-ins Adobe Acrobat vi XV fv Excel Options General View and manage Microsoft Office Add-ins. Formulas Data Add-ins V AA AB AC Location Save Active Application Add- ins Language Acrobat PDFMaker Office COM Addin CAProgram Files (x86 \\Adobe Acrobat DC) COM Add-in Accessibili Analysis ToolPak ciProgram Files\\Microsoft Office\ oot Offi E Excel Add-in Advanced Ci\\Program Files\\ Microsoft Excel Add- in Customize Ribbon XLSTAT Starter Ci\\Program Files \\Addinsoff\\XLSTAR XLSTAT Excel Add-in quick Access Vox Inactive Application Add-ins Add-ins Analysis ToolPak - VBA Ci\\Program Files\\ Microsoft Office root\\ Offi Excel Add-ir CAProgram Files\\ Common Files\\ Microsoft Euro Currency Tools Ci\\Program Files\\ Microsoft Office\\ root\\ Off Action CA\\ Program Files (x86]\\Microsoft Office\\ Offi COMAdd-in Microsoft Actions Pane 3 XML Expansion Pack Microsoft Data Streamer for Excel C.\\Program Files\\ Microsoft Office\ oot\\ Off COM Add-in Add-in Acrobat PDFMaker Office COM Addin Publisher. Adobe Inc. Compatibility: No compatibility information available Ci\\Program Files (4867\\Adobe\\Acrobat DC\\PDFMaker\\ Office\\x 64\\PDFMOfficeAddin.all Description: Acrobat PDFMaker Office COM Addin Manage Excel Add- ins OK CancelA B C D F G H J K L M N O P O R Station: 2 Remarks: 3 1. All Pollutant unit in & g/m3 except CO which is in 10u g/m3 2. N.A. = data not available 6 STATION POLLUTANT YEAR Month 01 Month 02 Month 03 Month 04 Month 05 Month 06 Month 07 Month 08 Month 09 Month 10 Month 11 Month 12 CENTRAL/WESTERI Respirable Suspended Particulates 2018 44 47 42 42 22 21 18 24 29 41 37 38 8 CENTRAL/WESTERI Respirable Suspended Particulates 2019 51 31 29 23 25 13 19 21 31 38 43 39 CENTRAL/WESTERI Respirable Suspended Particulates 2020 32 27 33 29 17 9 8 13 19 33 36 42 10 CENTRAL/WESTERI Respirable Suspended Particulates 2021 48 31 34 32 14 16 13 12 17 23 32 37 CENTRAL/WESTERI Respirable Suspended Particulates 2022 35 19 27 25 16 10 13 13 36 28 20 25 12 CENTRAL/WESTERI Respirable Suspended Particulates 2023 30 28 28 30 25 8 9 9 10 20 31 34 13 14 15 16 17 18 19 20 21A B C D E F G Hong Kong Observatory Mean Daily Max Mean Daily 2 Year Temp ('C) Year Max Temp (C) 3 1904 24.7 1994 25.9 A 1905 24.5 1995 25.2 1906 24.7 1996 25.6 1907 24.8 1997 25.5 1908 24.6 1998 26.3 8 1909 25 1999 26.2 9 1910 24.8 2000 25.5 10 1911 24.7 2001 25.8 11 1912 24.8 2002 26 12 1913 24.7 2003 25.8 13 1914 25.5 2004 25.6 14 1915 25.5 2005 25.4 15 1916 24.7 2006 25.8 16 1917 24.2 2007 26.4 17 1918 24.3 2008 25.8 18 1919 24.7 2009 26.3 19 1920 24.6 2010 25.8 20 1921 25 2011 25.8 21 1922 25 2012 25.8 22 1923 25 2013 25.9 23 1924 24.9 2014 26 24 1925 24.6 2015 26.6 25 1926 24.5 2016 26.1 26 1927 24.4 2017 26.4 27 1928 25 2018 26.6 28 1929 25.1 2019 27.1 29 1930 25 2020 27.2 30 1931 25 2021 27.5 31 1932 24.9 2022 26.7 32 1933 25.6 2023 27.2 33A B C D E F 1 Hong Kong Observatory Happy Valley 2 Year Total rainfall (mm) Year Total rainfall (mm) 3 2012 1924.7 2012 1887 4 2013 2847.3 2013 2519 5 2014 2638.3 2014 2561.5 2015 1874.5 2015 1864 2016 3026.8 2016 2878.5 8 2017 2572.1 2017 2578.5 9 2018 2162.9 2018 2338 10 2019 2396.2 2019 2378.5 11 2020 2395 2020 2367.5 12 2021 2307.1 2021 2395 13 2022 2205.4 2022 2155 14 2023 2774.5 2023 2876 15 16 17A B C D E F G 2 Mean Wind Speed (km/h) Year 3 Month 2020 2021 2022 2023 4 Hong Kong 16.9 13.9 13.2 13.4 5 International 17.2 14.5 15 16.2 Arport 18.3 16.7 16.5 15.3 14.5 17.7 14.8 8 17.1 15 16 15.1 15.7 9 16.7 16.7 16.7 12.9 10 S = S D O J O U A W N 16.7 15 16.5 14.1 11 14.2 13 13.7 12 12.2 14.2 12 14.5 13 15.8 18.3 16.9 16.8 14 15.3 14.5 13.5 15.3 13.6 15 14.9 13 13.5 12.8 16 Cheung Chau 18.6 17.7 15.6 16.4 17 17.6 16.2 19.6 17.3 18 16.8 16.5 19 14.7 17 15.7 19.4 15.5 18.6 20 15 17.3 18 16.7 21 18 SE S D DO J A UI A W N L 18.7 16.7 16.5 22 17 17 19.8 16.6 23 16.9 13.5 17.1 13.2 24 16.3 14 17.2 18.5 25 24 25.9 23 26 21.3 19.1 18.1 19.1 19 27 20.4 18.6 20.6 18 28 Waglan Island 26. 1 25.2 24.8 29 24.8 25.5 21.1 27.1 26 30 22.2 22.6 20.3 22.1 31 21.2 24.4 18.9 32 22.3 18.3 19.6 24.2 19.8 33 21.6 23.1 21.1 FE S DO. JO UI A W N - 17.6 34 21 19.5 22.4 35 18.6 17.8 16.5 18.6 14.9 36 19.4 16.7 21.5 19.6 37 37.2 34.4 32 38 28.4 26.9 24.9 27.7 39 24.9 26.4 27.7 28.6 40 21.7

Step by Step Solution

There are 3 Steps involved in it

1 Expert Approved Answer
Step: 1 Unlock blur-text-image
Question Has Been Solved by an Expert!

Get step-by-step solutions from verified subject matter experts

Step: 2 Unlock
Step: 3 Unlock

Students Have Also Explored These Related Mathematics Questions!