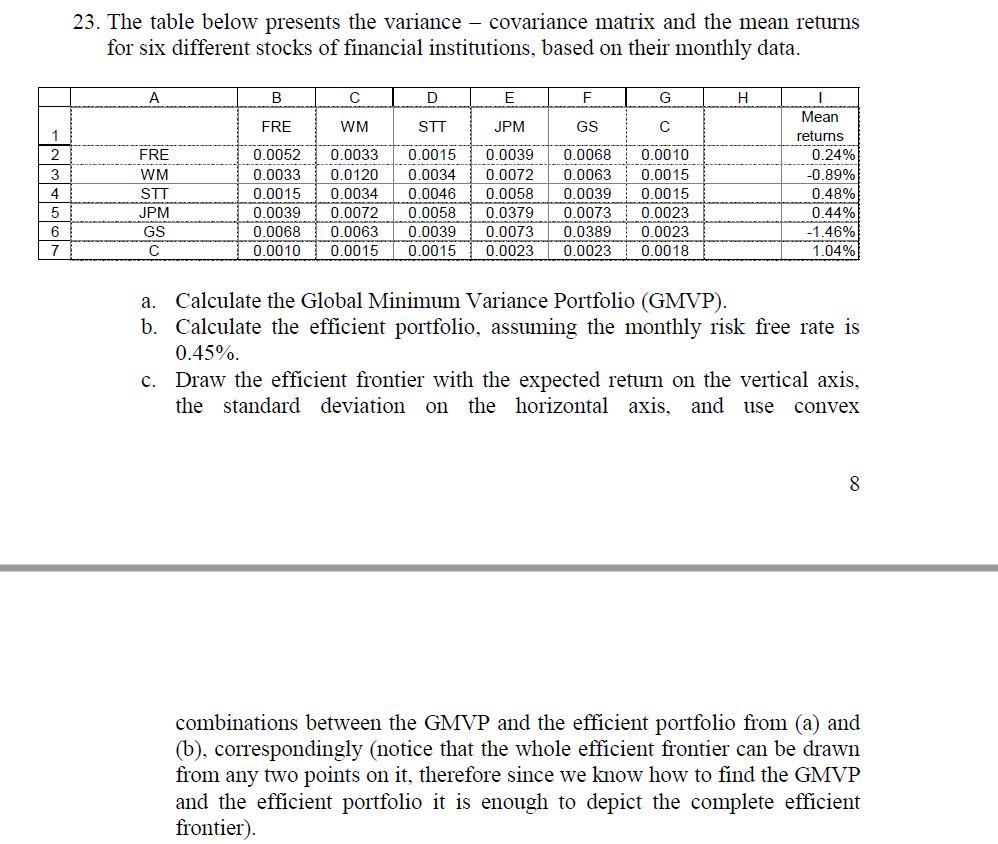
Question: Please solve the below in excel and share google sheet link if possible 23. The table below presents the variance - covariance matrix and the

Please solve the below in excel and share google sheet link if possible

Please solve the below in excel and share google
23. The table below presents the variance - covariance matrix and the mean returns for six different stocks of financial institutions, based on their monthly data. A B C D. E F G H FRE WM STT JPM GS C Mean returns 2 FRE 0.0052 0.0033 0.0015 0.0039 0.0068 0.0010 0.24% WM 0.0033 0.0120 0.0034 0.0072 0.0063 0.0015 0.89% STT 0.0015 0.0034 0.0046 0.0058 0.0039 0.0015 0.48% JPM 0.0039 0.0072 0.0058 0.0379 0.0073 0.0023 0.44% GS 0.0068 0.0063 0.0039 0.0073 0.0389 0.0023 -1.46% C 0.0010 0.0015 0.0015 0.0023 0.0023 0.0018 1.04% a. Calculate the Global Minimum Variance Portfolio (GMVP). b. Calculate the efficient portfolio, assuming the monthly risk free rate is 0.45%. c. Draw the efficient frontier with the expected return on the vertical axis, the standard deviation on the horizontal axis, and use convex 8 combinations between the GMVP and the efficient portfolio from (a) and (b), correspondingly (notice that the whole efficient frontier can be drawn from any two points on it, therefore since we know how to find the GMVP and the efficient portfolio it is enough to depict the complete efficient frontier)

Step by Step Solution

There are 3 Steps involved in it

1 Expert Approved Answer
Step: 1 Unlock blur-text-image
Question Has Been Solved by an Expert!

Get step-by-step solutions from verified subject matter experts

Step: 2 Unlock
Step: 3 Unlock

Students Have Also Explored These Related Finance Questions!