

Question: Please solve the excel sheet question on this drive all data is here on this link! https://drive.google.com/file/d/10uCS7Jg40bK_k_o_sc72c3WdO2WGamWL/view?usp=sharing I want to get pass please help. Problem
Please solve the excel sheet question on this drive
all data is here on this link!
https://drive.google.com/file/d/10uCS7Jg40bK_k_o_sc72c3WdO2WGamWL/view?usp=sharing
I want to get pass please help.
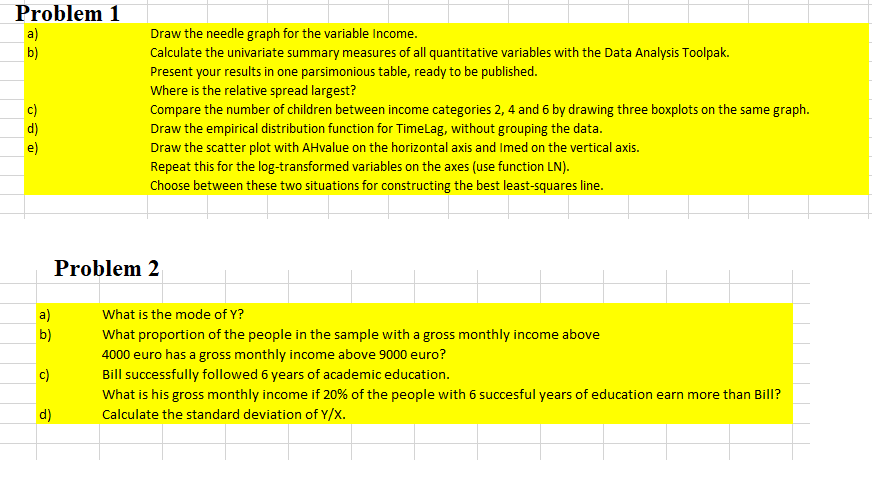
Problem 1 a) Draw the needle graph for the variable Income. b) Calculate the univariate summary measures of all quantitative variables with the Data Analysis Toolpak. Present your results in one parsimonious table, ready to be published. Where is the relative spread largest? Compare the number of children between income categories 2, 4 and 6 by drawing three boxplots on the same graph. Draw the empirical distribution function for TimeLag, without grouping the data. Draw the scatter plot with AHvalue on the horizontal axis and Imed on the vertical axis. Repeat this for the log-transformed variables on the axes (use function LN). Choose between these two situations for constructing the best least-squares line. Problem 2 What is the mode of Y? bi What proportion of the people in the sample with a gross monthly income above 4000 euro has a gross monthly income above 9000 euro? C) Bill successfully followed 6 years of academic education. What is his gross monthly income if 20% of the people with 6 succesful years of education earn more than Bill? d) Calculate the standard deviation of Y/X
Step by Step Solution
There are 3 Steps involved in it

Get step-by-step solutions from verified subject matter experts