Question: Please solve the final project about the report and prediction for this exploring mental health Kaggle competition dataset based on the guideline of the project.
Please solve the final project about the report and prediction for this exploring mental health Kaggle competition dataset based on the guideline of the project. It should be 8-10 pages total.
Kaggle Competition Exploring mental health homepage link: www.kaggle.com/competitions/playground-series-s4e11/overview/evaluation
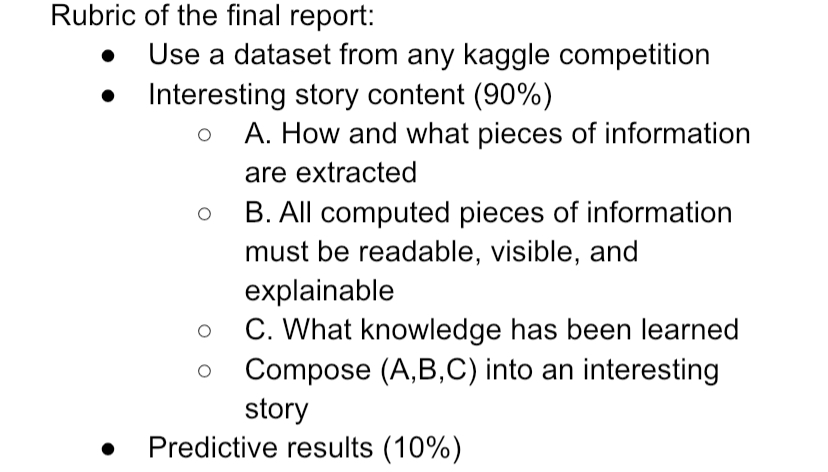
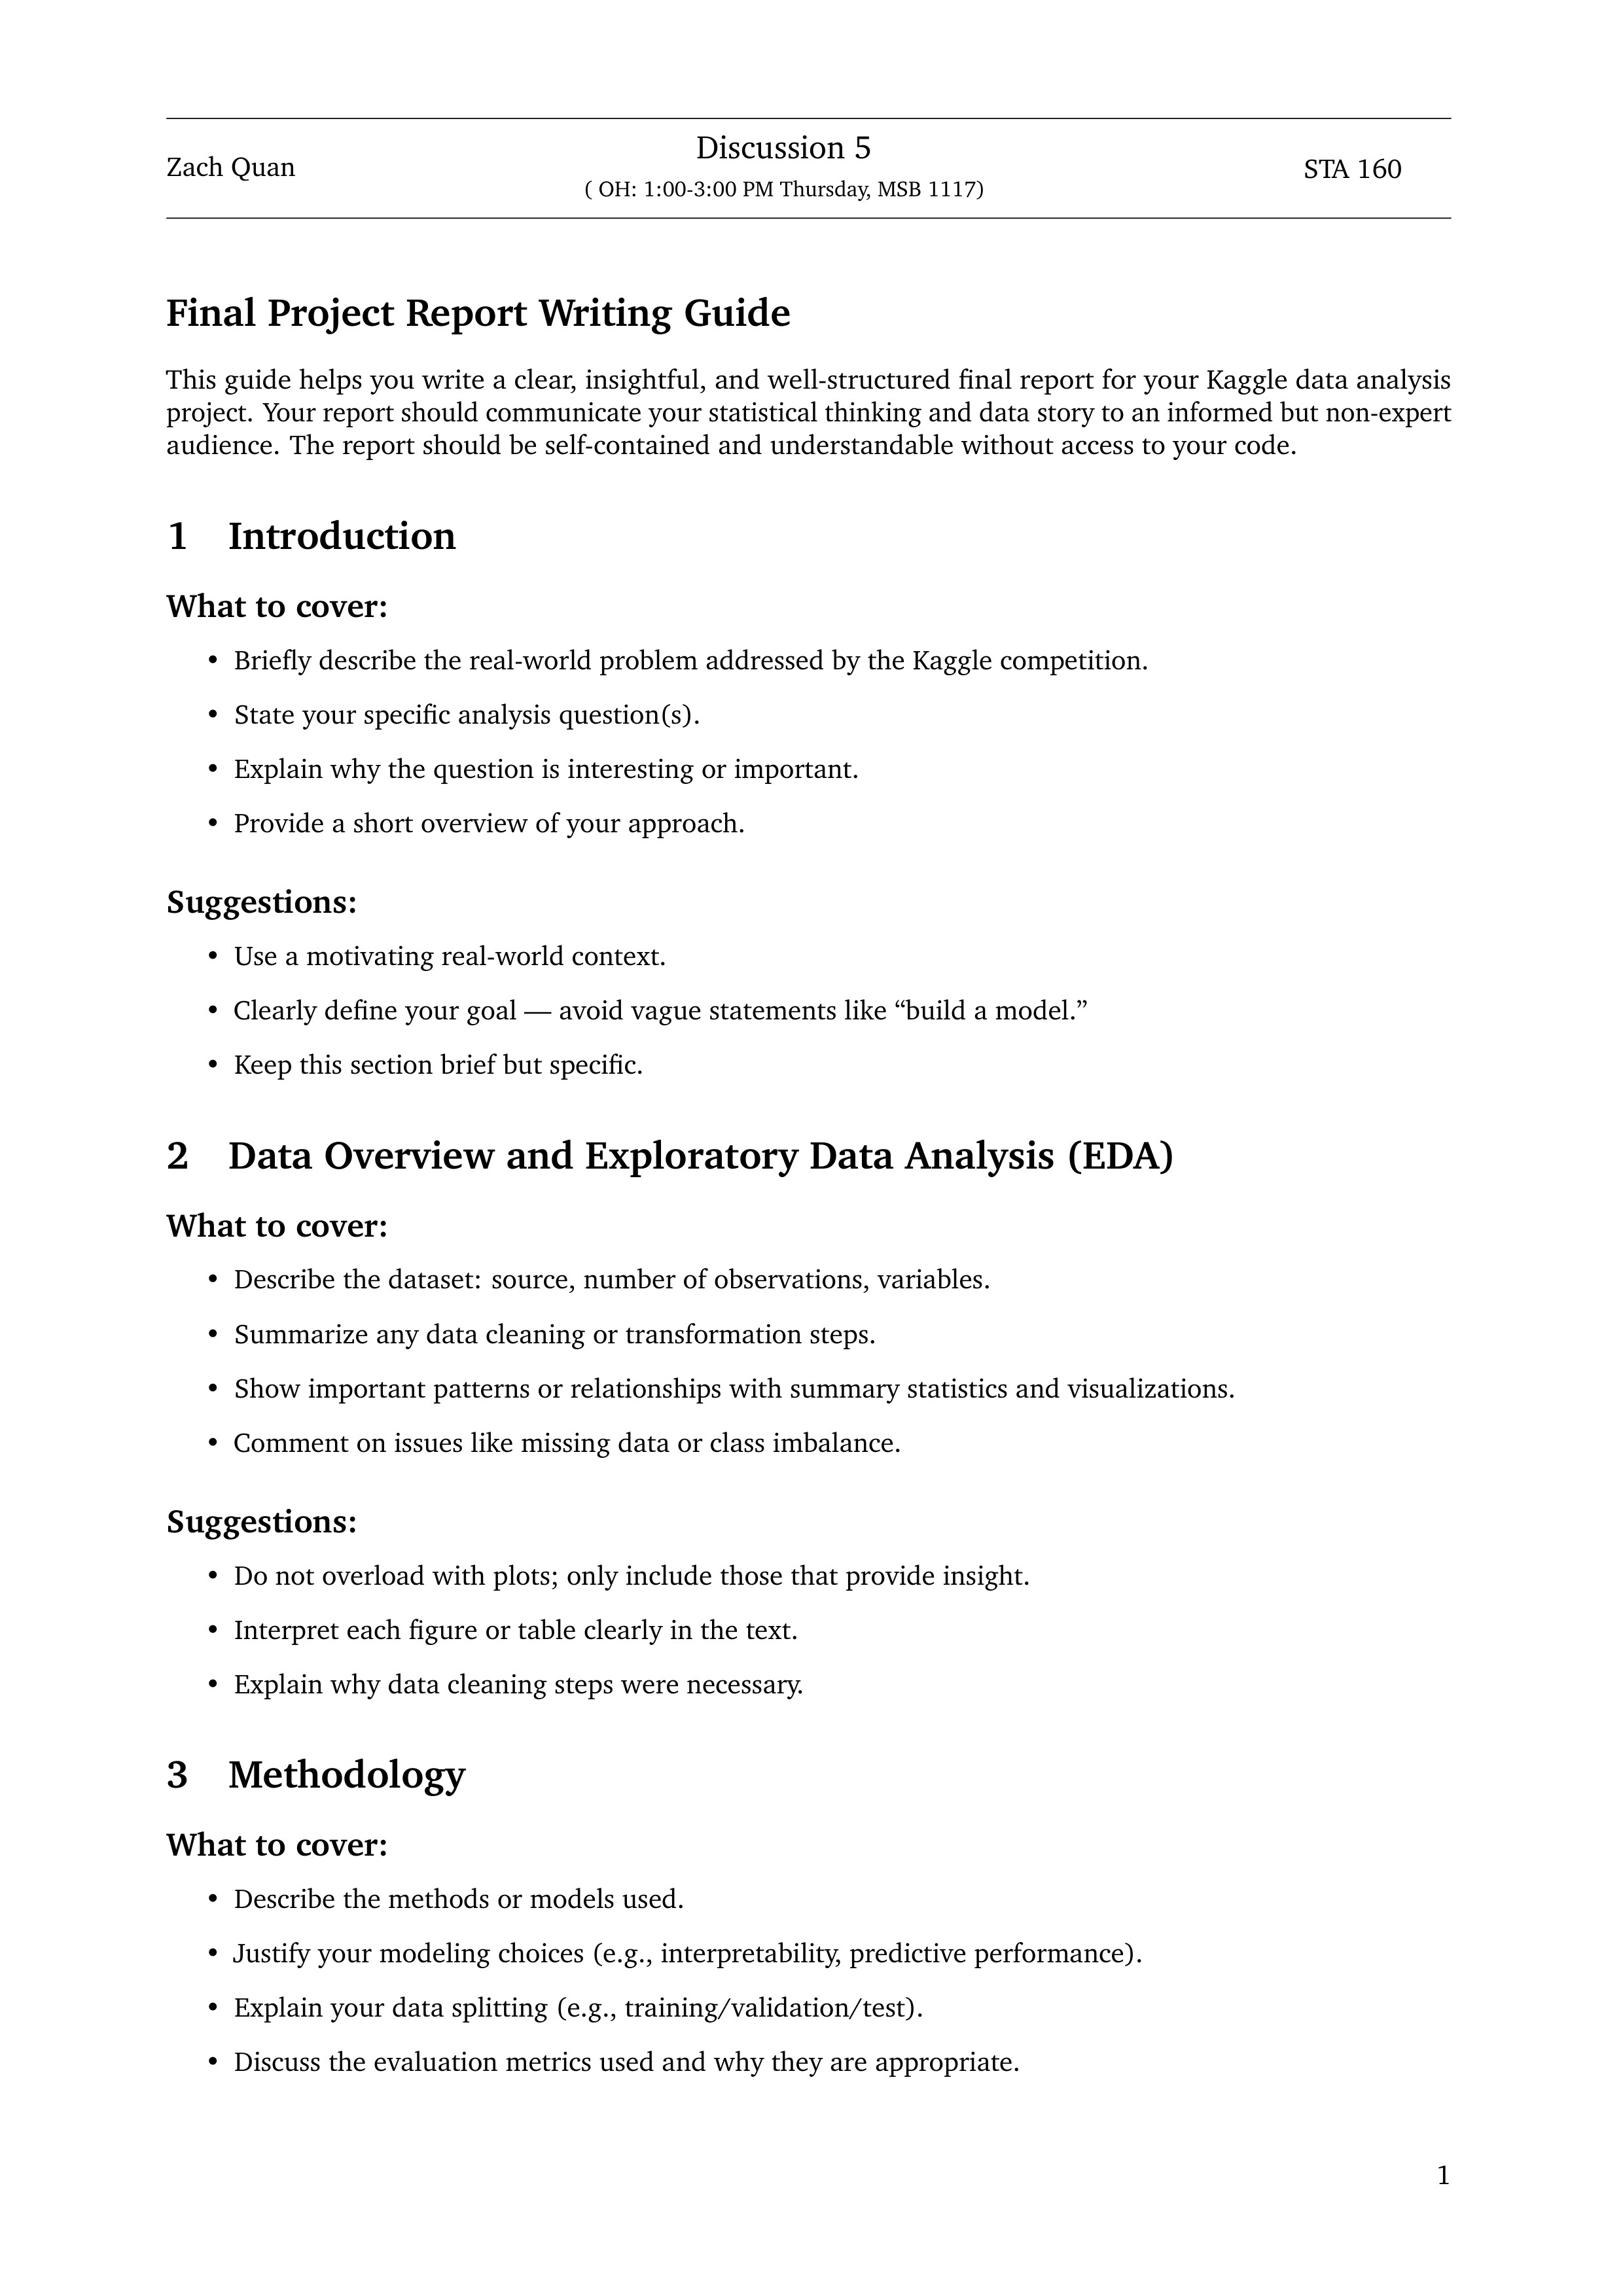
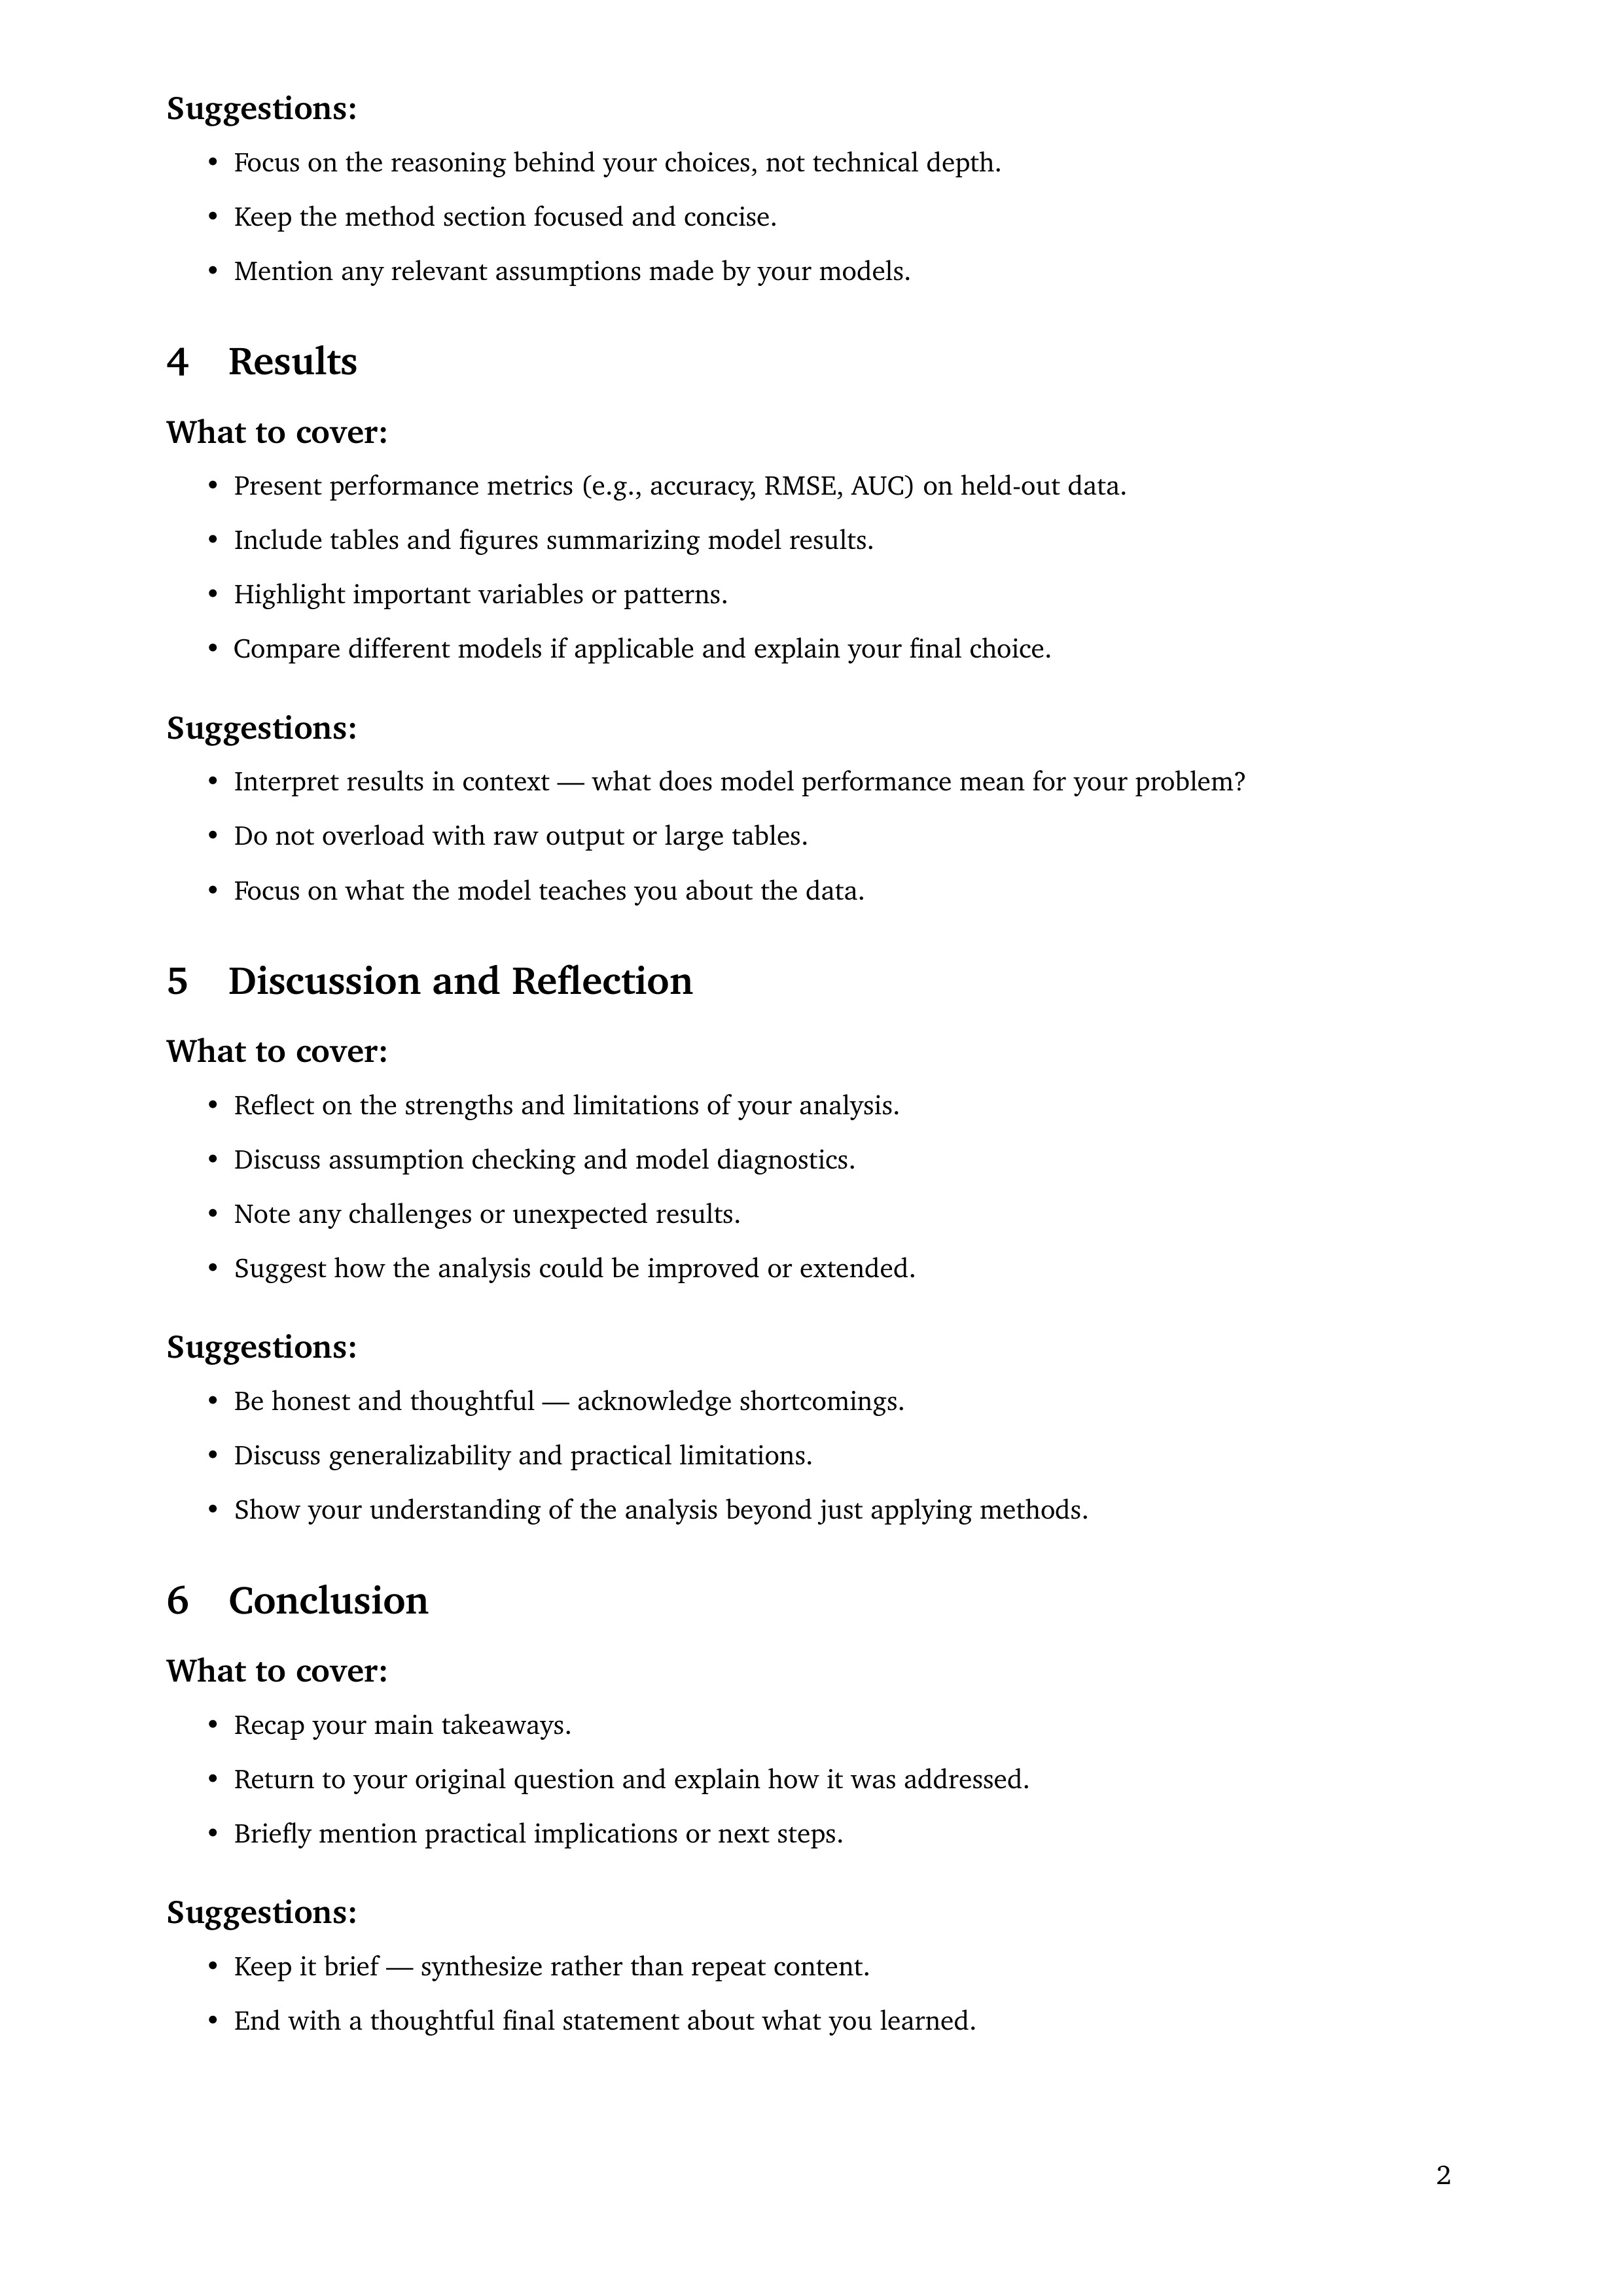
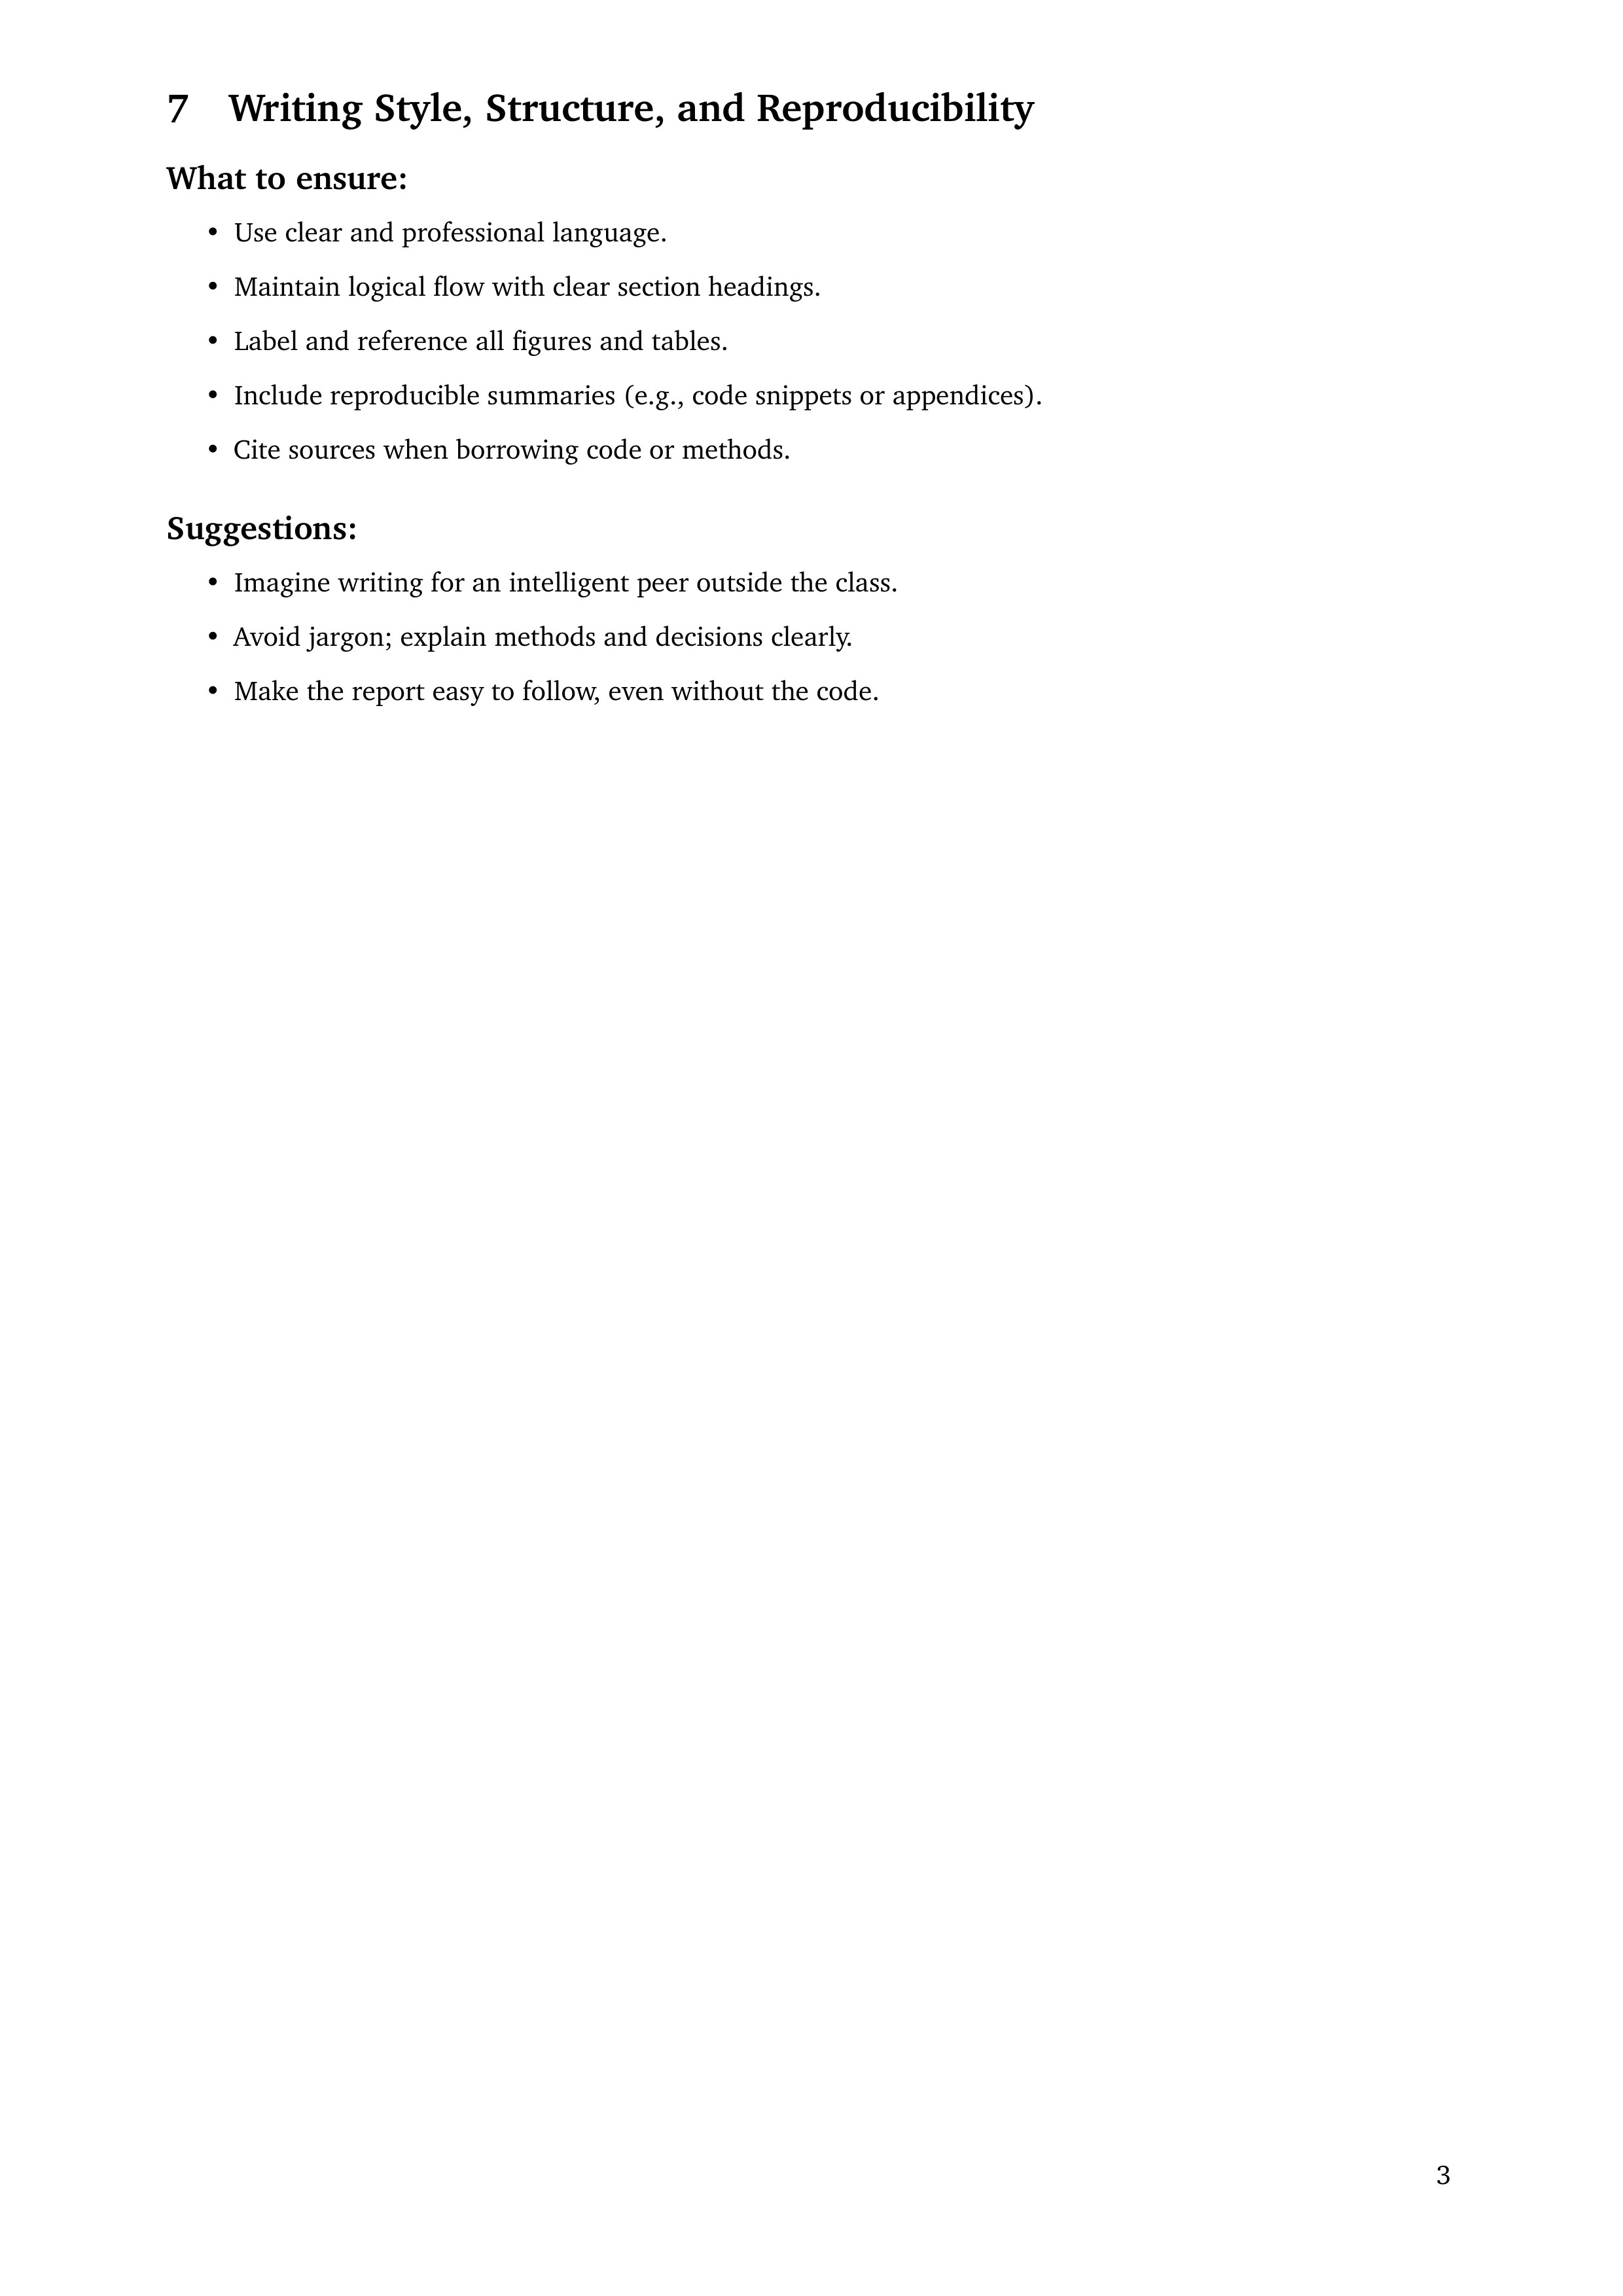
Rubric of the final report: e Use a dataset from any kaggle competition e Interesting story content (90%) A. How and what pieces of information are extracted B.AIll computed pieces of information must be readable, visible, and explainable C. What knowledge has been learned Compose (A,B,C) into an interesting story e Predictive results (10%) Discussion 5 Zach Quan STA 160 ( OH: 1:00-3:00 PM Thursday, MSB 1117) Final Project Report Writing Guide This guide helps you write a clear, insightful, and well-structured final report for your Kaggle data analysis project. Your report should communicate your statistical thinking and data story to an informed but non-expert audience. The report should be self-contained and understandable without access to your code. 1 Introduction What to cover: Briefly describe the real-world problem addressed by the Kaggle competition. State your specific analysis question(s). Explain why the question is interesting or important. Provide a short overview of your approach. Suggestions: Use a motivating real-world context. * Clearly define your goal avoid vague statements like \"build a model.\" Keep this section brief but specific. 2 Data Overview and Exploratory Data Analysis (EDA) What to cover: * Describe the dataset: source, number of observations, variables. Summarize any data cleaning or transformation steps. Show important patterns or relationships with summary statistics and visualizations. Comment on issues like missing data or class imbalance. Suggestions: * Do not overload with plots; only include those that provide insight. Interpret each figure or table clearly in the text. Explain why data cleaning steps were necessary. 3 Methodology What to cover: * Describe the methods or models used. Justify your modeling choices (e.g., interpretability, predictive performance). Explain your data splitting (e.g., training/validation/test). Discuss the evaluation metrics used and why they are appropriate. Suggestions: Focus on the reasoning behind your choices, not technical depth. Keep the method section focused and concise. Mention any relevant assumptions made by your models. 4 Results What to cover: Present performance metrics (e.g., accuracy, RMSE, AUC) on held-out data. Include tables and figures summarizing model results. Highlight important variables or patterns. * Compare different models if applicable and explain your final choice. Suggestions: Interpret results in context what does model performance mean for your problem? * Do not overload with raw output or large tables. * Focus on what the model teaches you about the data. 5 Discussion and Reflection What to cover: Reflect on the strengths and limitations of your analysis. Discuss assumption checking and model diagnostics. Note any challenges or unexpected results. Suggest how the analysis could be improved or extended. Suggestions: Be honest and thoughtful acknowledge shortcomings. Discuss generalizability and practical limitations. Show your understanding of the analysis beyond just applying methods. 6 Conclusion What to cover: Recap your main takeaways. Return to your original question and explain how it was addressed. Briefly mention practical implications or next steps. Suggestions: Keep it brief synthesize rather than repeat content. End with a thoughtful final statement about what you learned. 7 Writing Style, Structure, and Reproducibility What to ensure: * Use clear and professional language. Maintain logical flow with clear section headings. Label and reference all figures and tables. Include reproducible summaries (e.g., code snippets or appendices). * Cite sources when borrowing code or methods. Suggestions: Imagine writing for an intelligent peer outside the class. Avoid jargon; explain methods and decisions clearly. Make the report easy to follow, even without the code
Step by Step Solution
There are 3 Steps involved in it
1 Expert Approved Answer
Step: 1 Unlock
Question Has Been Solved by an Expert!
Get step-by-step solutions from verified subject matter experts
Step: 2 Unlock
Step: 3 Unlock
Students Have Also Explored These Related Accounting Questions!