

Question: Please solve the following matlab question and provide the correct code. 2. The table below shows some data recorded from a group of participants. The
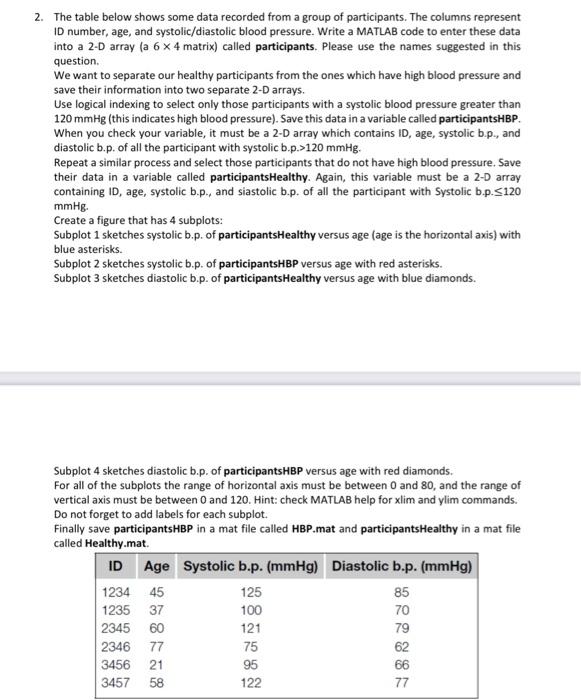
2. The table below shows some data recorded from a group of participants. The columns represent ID number, age, and systolic/diastolic blood pressure. Write a MATLAB code to enter these data into a 2-D array (a 64 matrix) called participants. Please use the names suggested in this question. We want to separate our healthy participants from the ones which have high blood pressure and save their information into two separate 2-D arrays. Use logical indexing to select only those participants with a systolic blood pressure greater than 120mmHg (this indicates high blood pressure). Save this data in a variable called participantsHBP. When you check your variable, it must be a 2-D array which contains ID, age, systolic b.p., and diastolic b.p. of all the participant with systolic b.p. >120mmHg. Repeat a similar process and select those participants that do not have high blood pressure. Save their data in a variable called participantsHealthy. Again, this variable must be a 2-D array containing ID, age, systolic b.p., and siastolic b.p. of all the participant with Systolic b.p. 120 mmHg. Create a figure that has 4 subplots: Subplot 1 sketches systolic b.p. of participantsHealthy versus age (age is the horizontal axis) with blue asterisks. Subplot 2 sketches systolic b.p. of participantsHBP versus age with red asterisks. Subplot 3 sketches diastolic b.p. of participantsHealthy versus age with blue diamonds. Subplot 4 sketches diastolic b.p. of participantsHBP versus age with red diamonds. For all of the subplots the range of horizontal axis must be between 0 and 80 , and the range of vertical axis must be between 0 and 120 . Hint: check MATLAB help for xlim and ylim commands. Do not forget to add labels for each subplot. Finally save participantsHBP in a mat file called HBP.mat and participantsHealthy in a mat file called Healthy.mat
Step by Step Solution
There are 3 Steps involved in it

Get step-by-step solutions from verified subject matter experts