

Question: please solve the problem in excel and post the solution including formulas Exercise 1 The table below contains the average returns standard deviation of returns
please solve the problem in excel and post the solution including formulas
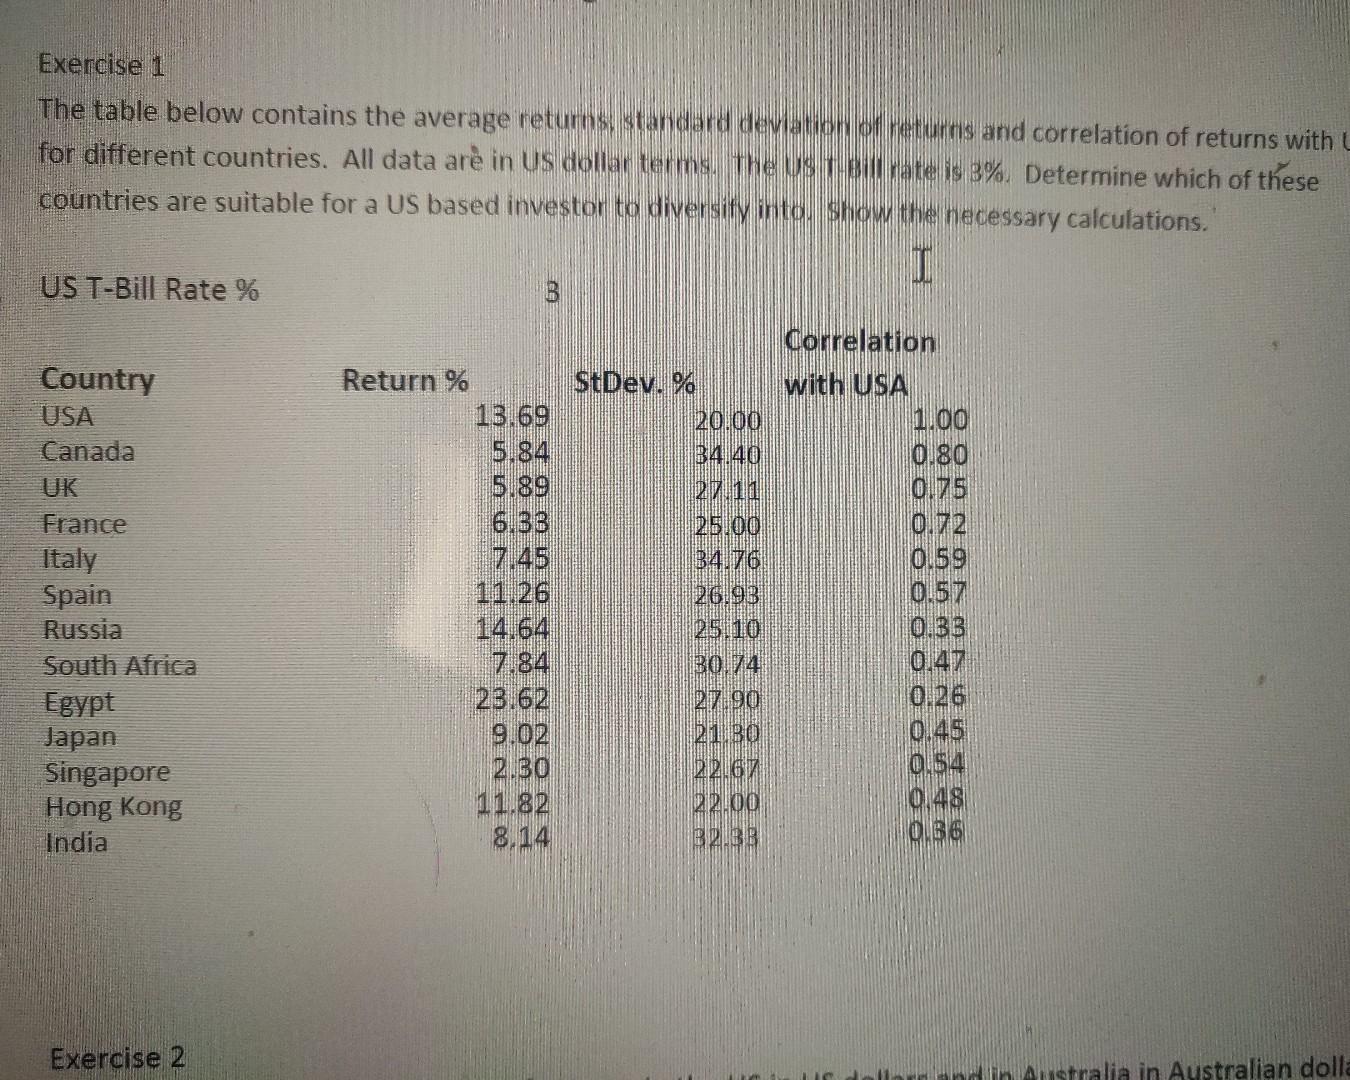
Exercise 1 The table below contains the average returns standard deviation of returns and correlation of returns with for different countries. All data are in US dollar terms, The US plate is 3%. Determine which of these countries are suitable for a US based investor to diversity into show the necessary calculations. I US T-Bill Rate % B Correlation Country Return % StDev. % with USA USA 13.69 20.00 1.00 Canada 5.84 34.40 0.80 UK 5.89 0.75 France 6.33 25.00 0.72 Italy B4.76 0.59 Spain 11:26 26.93 0.57 Russia 14.64 25.10 0.33 South Africa 7.84 BO.74 0.47 Egypt 23.62 27.90 0.26 Japan 9.02 21 BO 0.45 Singapore 2.30 0 54 22LGT Hong Kong 11.82 22.00 0.48 India 8.14 0 36 Exercise 2 Australia in Australian dolla Exercise 1 The table below contains the average returns standard deviation of returns and correlation of returns with for different countries. All data are in US dollar terms, The US plate is 3%. Determine which of these countries are suitable for a US based investor to diversity into show the necessary calculations. I US T-Bill Rate % B Correlation Country Return % StDev. % with USA USA 13.69 20.00 1.00 Canada 5.84 34.40 0.80 UK 5.89 0.75 France 6.33 25.00 0.72 Italy B4.76 0.59 Spain 11:26 26.93 0.57 Russia 14.64 25.10 0.33 South Africa 7.84 BO.74 0.47 Egypt 23.62 27.90 0.26 Japan 9.02 21 BO 0.45 Singapore 2.30 0 54 22LGT Hong Kong 11.82 22.00 0.48 India 8.14 0 36 Exercise 2 Australia in Australian dolla
Step by Step Solution
There are 3 Steps involved in it

Get step-by-step solutions from verified subject matter experts