

Question: please solve the problem on detailed steps showing how to calculate area under each graph using trapezoid rule Example # 3 A parallel arrangement of
please solve the problem on detailed steps showing how to calculate area under each graph using trapezoid rule
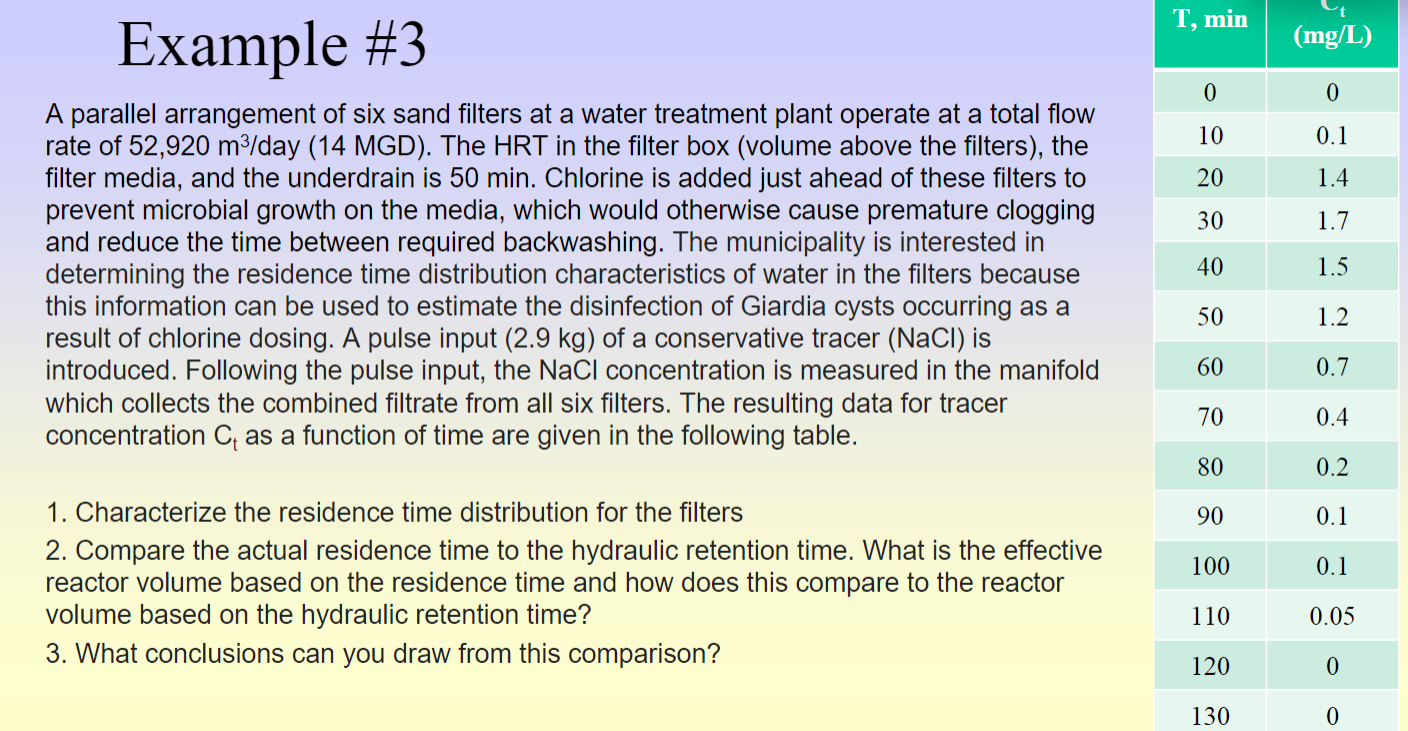
Example #
A parallel arrangement of six sand filters at a water treatment plant operate at a total flow
rate of day MGD The HRT in the filter box volume above the filters the
filter media, and the underdrain is min Chlorine is added just ahead of these filters to
prevent microbial growth on the media, which would otherwise cause premature clogging
and reduce the time between required backwashing. The municipality is interested in
determining the residence time distribution characteristics of water in the filters because
this information can be used to estimate the disinfection of Giardia cysts occurring as a
result of chlorine dosing. A pulse input of a conservative tracer is
introduced. Following the pulse input, the NaCl concentration is measured in the manifold
which collects the combined filtrate from all six filters. The resulting data for tracer
concentration as a function of time are given in the following table.
Characterize the residence time distribution for the filters
Compare the actual residence time to the hydraulic retention time. What is the effective
reactor volume based on the residence time and how does this compare to the reactor
volume based on the hydraulic retention time?
What conclusions can you draw from this comparison?
Plot C curve, E curve, Calculate mean residence
time, variance, skewness of the curve, and F curve
Step by Step Solution
There are 3 Steps involved in it
1 Expert Approved Answer
Step: 1 Unlock

Question Has Been Solved by an Expert!
Get step-by-step solutions from verified subject matter experts
Step: 2 Unlock
Step: 3 Unlock