

Question: Please solve the problem on the graph below: ks Window Help courseworks2.columbia.edu C Zoom Class Sessions Quiz: Quiz 1 U8213 Recitation 1 (Ariana) - Sat
Please solve the problem on the graph below:
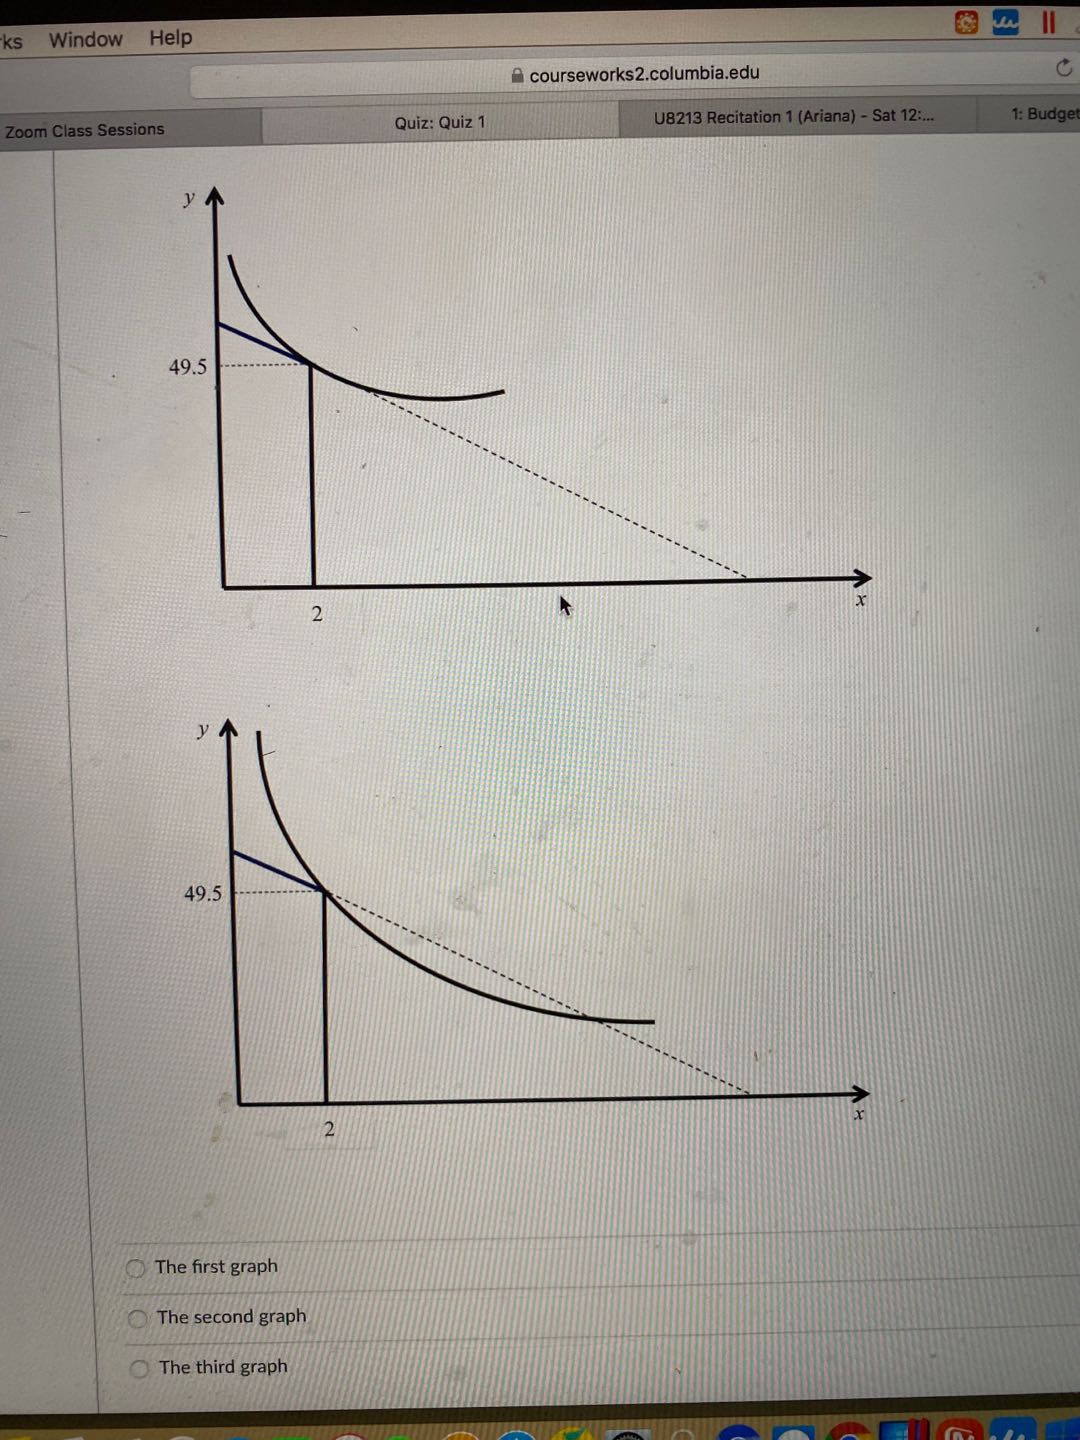
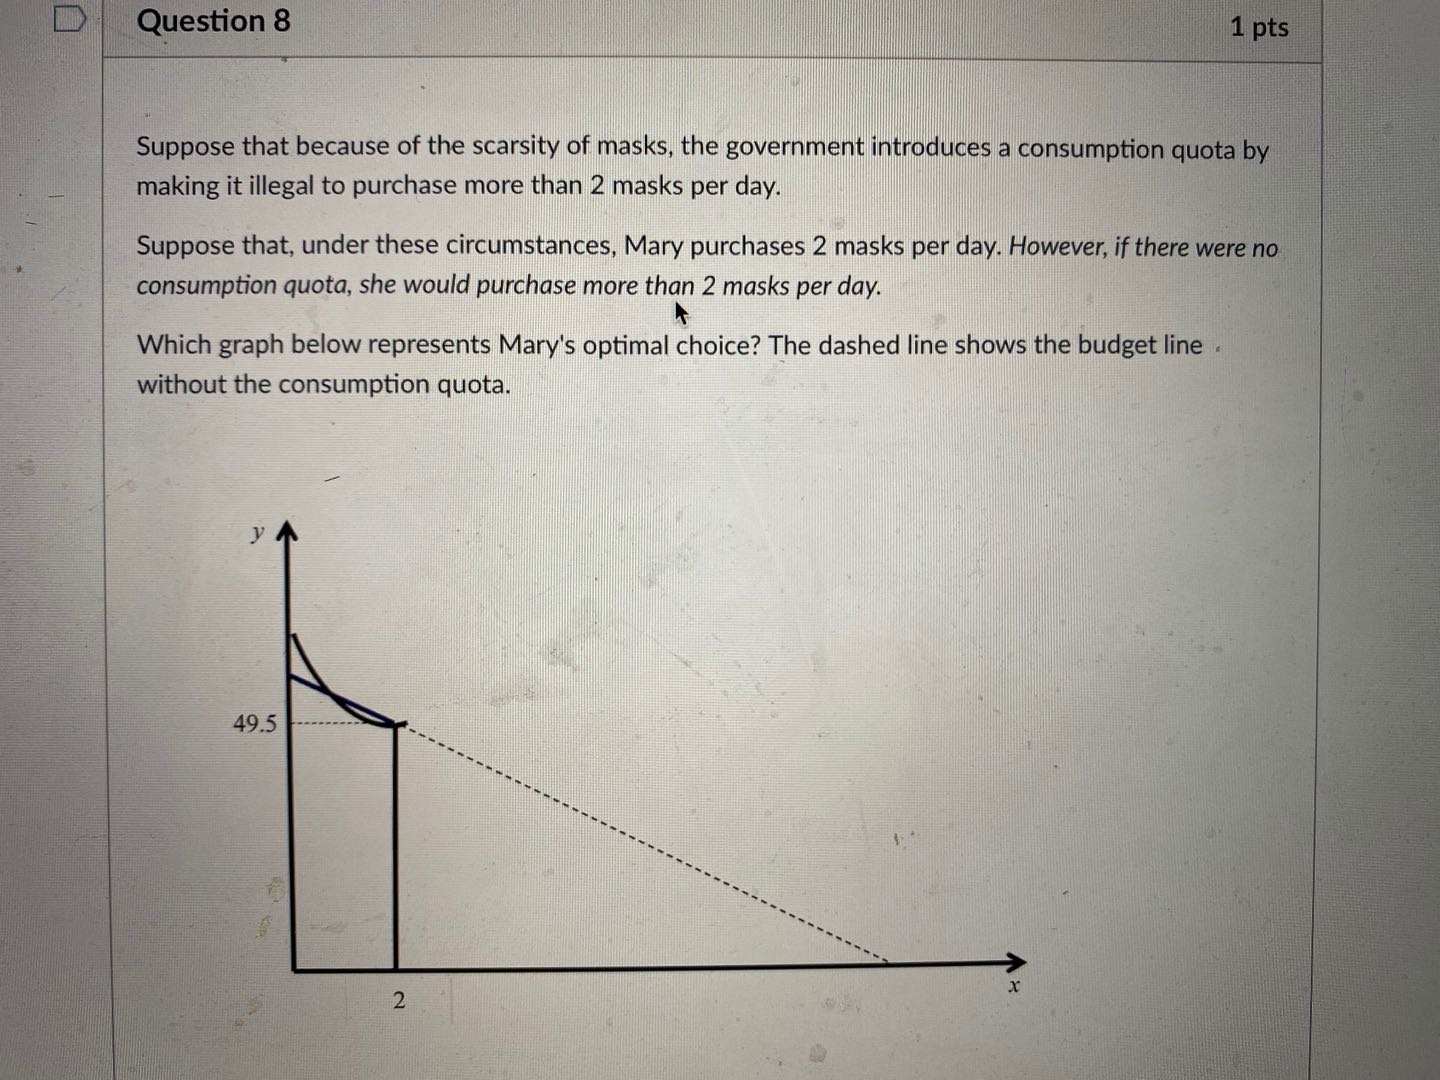
ks Window Help courseworks2.columbia.edu C Zoom Class Sessions Quiz: Quiz 1 U8213 Recitation 1 (Ariana) - Sat 12:... 1: Budge 49.5 2 49.5 The first graph The second graph The third graphD Question 8 1 pts Suppose that because of the scarsity of masks, the government introduces a consumption quota by making it illegal to purchase more than 2 masks per day. Suppose that, under these circumstances, Mary purchases 2 masks per day. However, if there were no consumption quota, she would purchase more than 2 masks per day. Which graph below represents Mary's optimal choice? The dashed line shows the budget line . without the consumption quota. 49.5 2
Step by Step Solution
There are 3 Steps involved in it

Get step-by-step solutions from verified subject matter experts