

Question: Please solve the question step by step without and resources because I'm not allowed to use any resources to solve the assignment Thanks 1. The
Please solve the question step by step without and resources because I'm not allowed to use any resources to solve the assignment Thanks
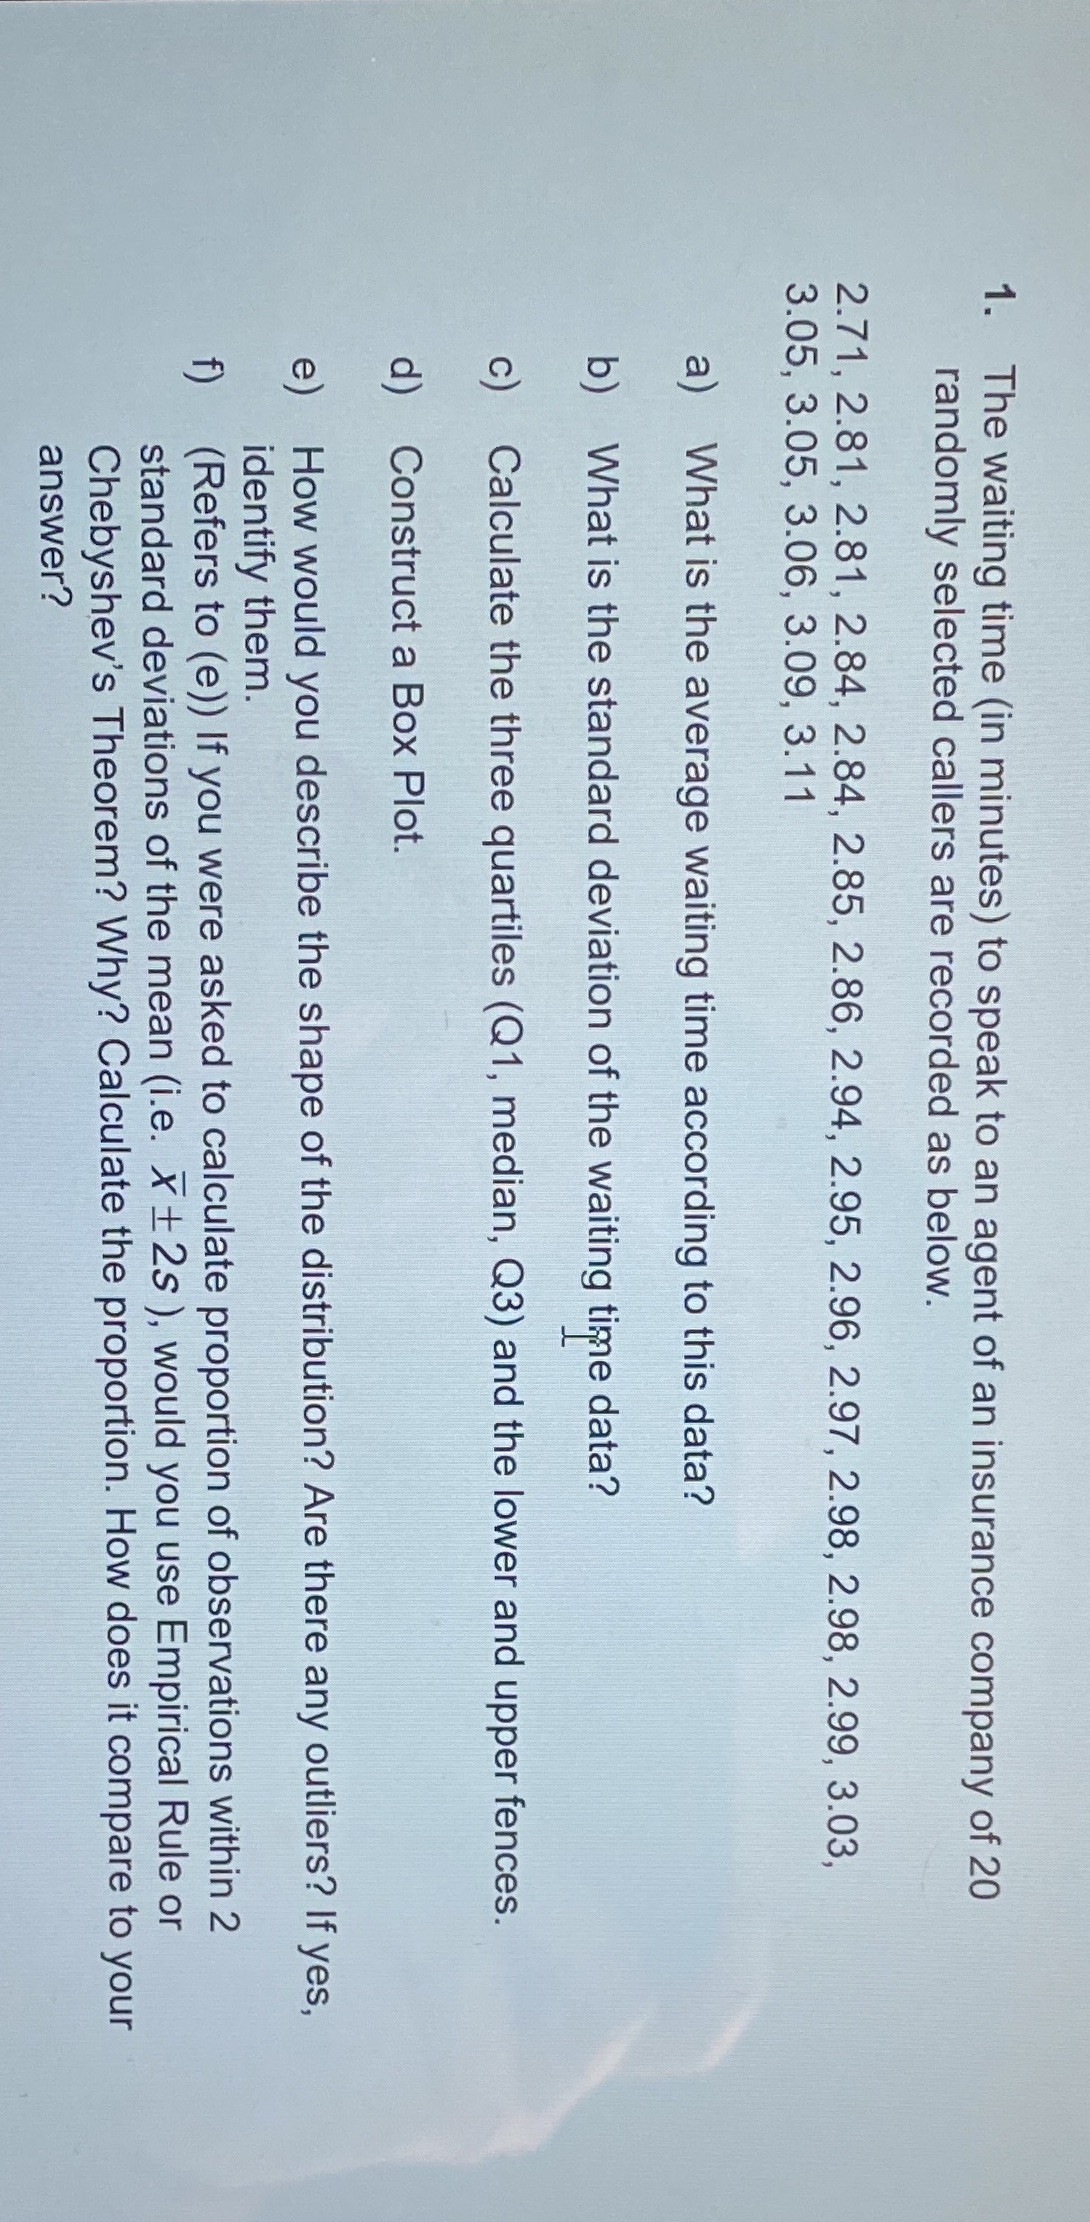
1. The waiting time (in minutes) to speak to an agent of an insurance company of 20 randomly selected callers are recorded as below. 2.71, 2.81, 2.81, 2.84, 2.84, 2.85, 2.86, 2.94, 2.95, 2.96, 2.97, 2.98, 2.98, 2.99, 3.03, 3.05, 3.05, 3.06, 3.09, 3.11 a) What is the average waiting time according to this data? b) What is the standard deviation of the waiting time data? c) Calculate the three quartiles (Q1, median, Q3) and the lower and upper fences. d) Construct a Box Plot. e) How would you describe the shape of the distribution? Are there any outliers? If yes, identify them. (Refers to (e)) If you were asked to calculate proportion of observations within 2 standard deviations of the mean (i.e. X + 2s ), would you use Empirical Rule or Chebyshev's Theorem? Why? Calculate the proportion. How does it compare to your
Step by Step Solution
There are 3 Steps involved in it

Get step-by-step solutions from verified subject matter experts