

Question: please solve the question without using excel (a) Table 2.1 presents the sales data for Company Excellent from 2012 to 2020. Year 2012 2013 2014
please solve the question without using excel
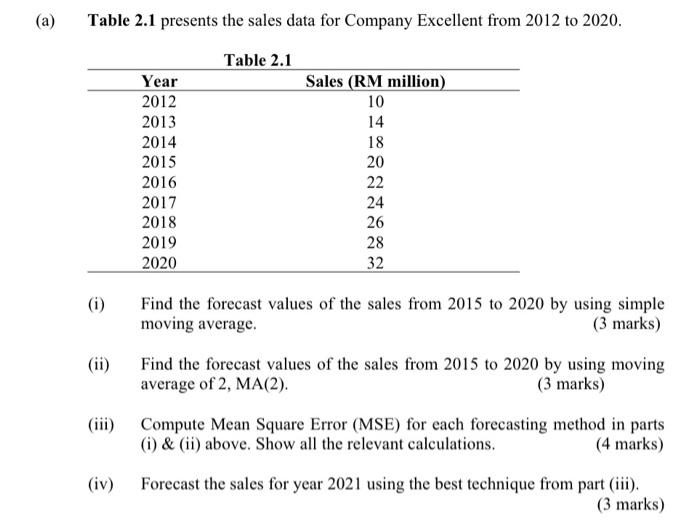
(a) Table 2.1 presents the sales data for Company Excellent from 2012 to 2020. Year 2012 2013 2014 2015 2016 2017 2018 2019 2020 Table 2.1 Sales (RM million) 10 14 18 20 22 24 26 28 32 (i) Find the forecast values of the sales from 2015 to 2020 by using simple moving average. (3 marks) Find the forecast values of the sales from 2015 to 2020 by using moving average of 2, MA(2) (3 marks) (iii) Compute Mean Square Error (MSE) for each forecasting method in parts (i) & (ii) above. Show all the relevant calculations. (4 marks) (iv) Forecast the sales for year 2021 using the best technique from part (iii)
Step by Step Solution
There are 3 Steps involved in it
1 Expert Approved Answer
Step: 1 Unlock

Question Has Been Solved by an Expert!
Get step-by-step solutions from verified subject matter experts
Step: 2 Unlock
Step: 3 Unlock