

Question: please solve this assignment.. (Statistical Programming) The following table shows the numbers of hours spent by a child on different events on a working day.
please solve this assignment.. (Statistical Programming) 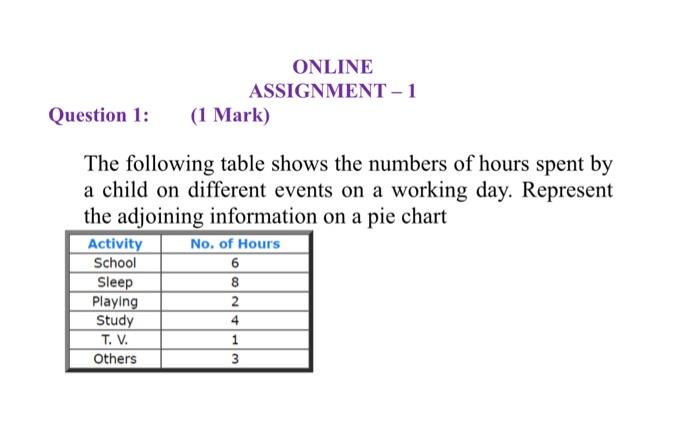
The following table shows the numbers of hours spent by a child on different events on a working day. Represent the adjoining information on a pie chart
Step by Step Solution
There are 3 Steps involved in it
1 Expert Approved Answer
Step: 1 Unlock

Question Has Been Solved by an Expert!
Get step-by-step solutions from verified subject matter experts
Step: 2 Unlock
Step: 3 Unlock