

Question: Please solve this. do it in excel. all plots and calculations needs to be done in excel.excel sheet needs to be shared. 2- Using the
Please solve this. do it in excel. all plots and calculations needs to be done in excel.excel sheet needs to be shared.
![will be: [10%] a. Less than 1.07 years. b. More than 1.34](https://s3.amazonaws.com/si.experts.images/answers/2024/07/6691b86f9bb73_9676691b86f75fb8.jpg)
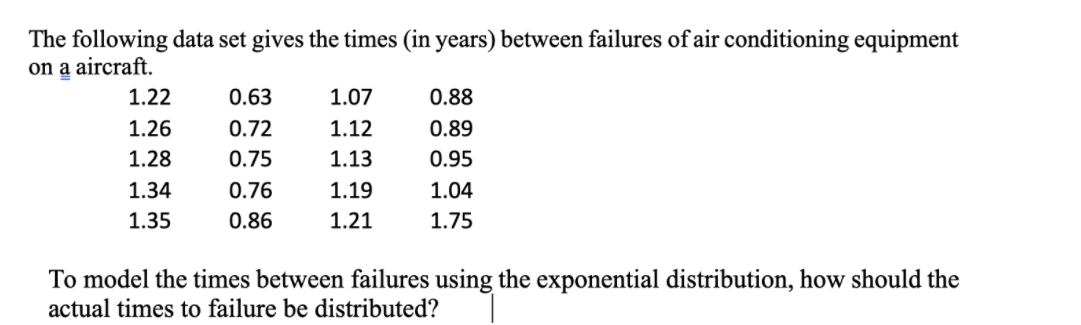
2- Using the exponential distribution, work out the probability that the time between failures will be: [10%] a. Less than 1.07 years. b. More than 1.34 years. c. Between 0.5 and 0.75 years. 3. Test, using a probability plot for the exponential and Weibull distributions, whether times between failures are exponentially distributed (as opposed to Weibull distributed). [10%] Using the Weibull distribution estimate: a. The 63rd quantile of the times between failure. b. The value for B.Using the t test, produce a 95% confidence interval for the mean. Use your answer to explain if this mean is significantly different from 0.9 at the 5% significance level. Explain fully any assumptions behind the t test and the implications such assumptions have for the power of the test. [15%]The following data set gives the times (in years) between failures of air conditioning equipment on g aircraft. 1.22 0.63 1.07 0.88 1.26 0.72 1.12 0.89 1.23 0.75 1.13 0.95 1.34 0.76 1.19 1.04 1.35 0.86 1.21 1.75 To model the times between failures using the exponential distribution, how should the actual times to failure be distributed
Step by Step Solution
There are 3 Steps involved in it

Get step-by-step solutions from verified subject matter experts