

Question: Please solve this ( especially interpret ) in detail subject - time series in R software - Exercise 1. Correlation Use the CO2 dataset (loaded
 Please solve this ( especially interpret ) in detail
subject - time series in R software -
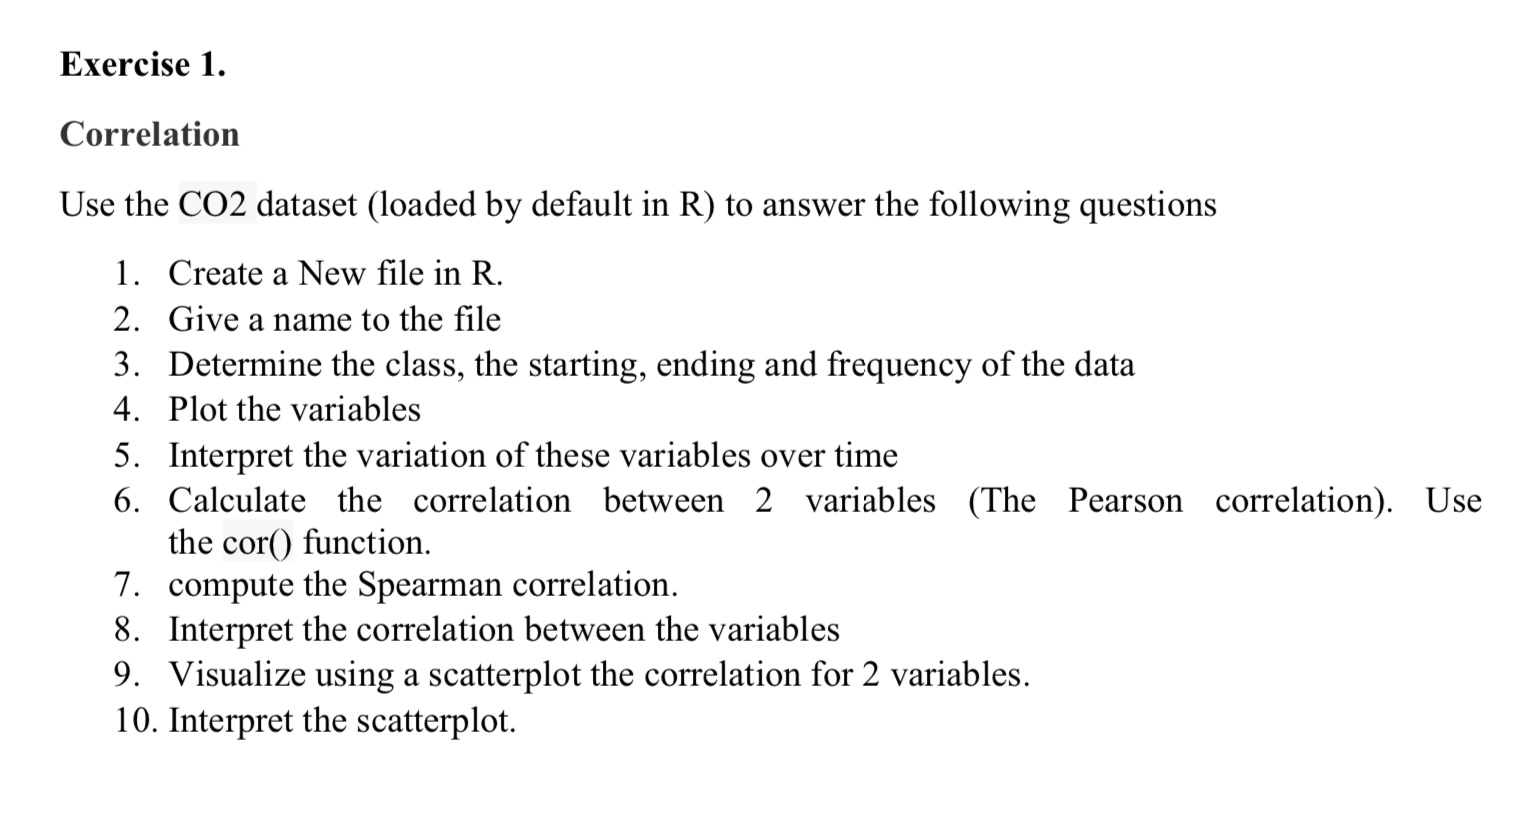
Exercise 1. Correlation Use the CO2 dataset (loaded by default in R) to answer the following questions 1. Create a New file in R. 2. Give a name to the file 3. Determine the class, the starting, ending and frequency of the data 4. Plot the variables 5. Interpret the variation of these variables over time 6. Calculate the correlation between 2 variables (The Pearson correlation). Use the cor() function. 7. compute the Spearman correlation. 8. Interpret the correlation between the variables 9. Visualize using a scatterplot the correlation for 2 variables. 10. Interpret the scatterplot
Step by Step Solution
There are 3 Steps involved in it

Get step-by-step solutions from verified subject matter experts