

Question: Please solve this. f2. The spreadsheet will compute the mean and standard deviation for each of the four groups. Look at these means and standard
Please solve this.
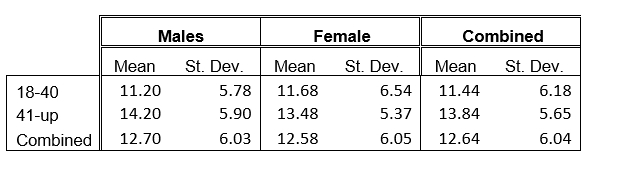
\f2. The spreadsheet will compute the mean and standard deviation for each of the four groups. Look at these means and standard deviations. Analyze these data. What do you find? Why do you think this is so? 3. Compare the means and standard deviations of males and females. Analyze these data. What do you find? Why do you think this is so? 4. Compare the means and standard deviations of younger and older. Analyze these data. What do you find? Why do you think this is so? Your analysis should be 3-5 sentences (a paragraph) for each of the three questions. Include an introduction and a closing paragraph. So, your total product should resemble a typical essay. NOTE: Make sure all three of your analyses include both the mean and the standard deviations. Type your essay as a separate document. Submit both your spreadsheet and your essay. DUE Midnight May 13We are all addicted to television-sports, movies, dramas, soaps. With the proliferation of satellite, cable, DVRs, we're probably watching more television than we have in the past. Who do you think watches more television: men or women, younger or older people? In this project you will collect data in order to try to answer these questions. After some computations, you will analyze the data you have collected
Step by Step Solution
There are 3 Steps involved in it

Get step-by-step solutions from verified subject matter experts