

Question: Please solve this in matlab. Inlcude all code and comments so I can learn. I will thumbs up your answer Data have been reported for
Please solve this in matlab. Inlcude all code and comments so I can learn. I will thumbs up your answer
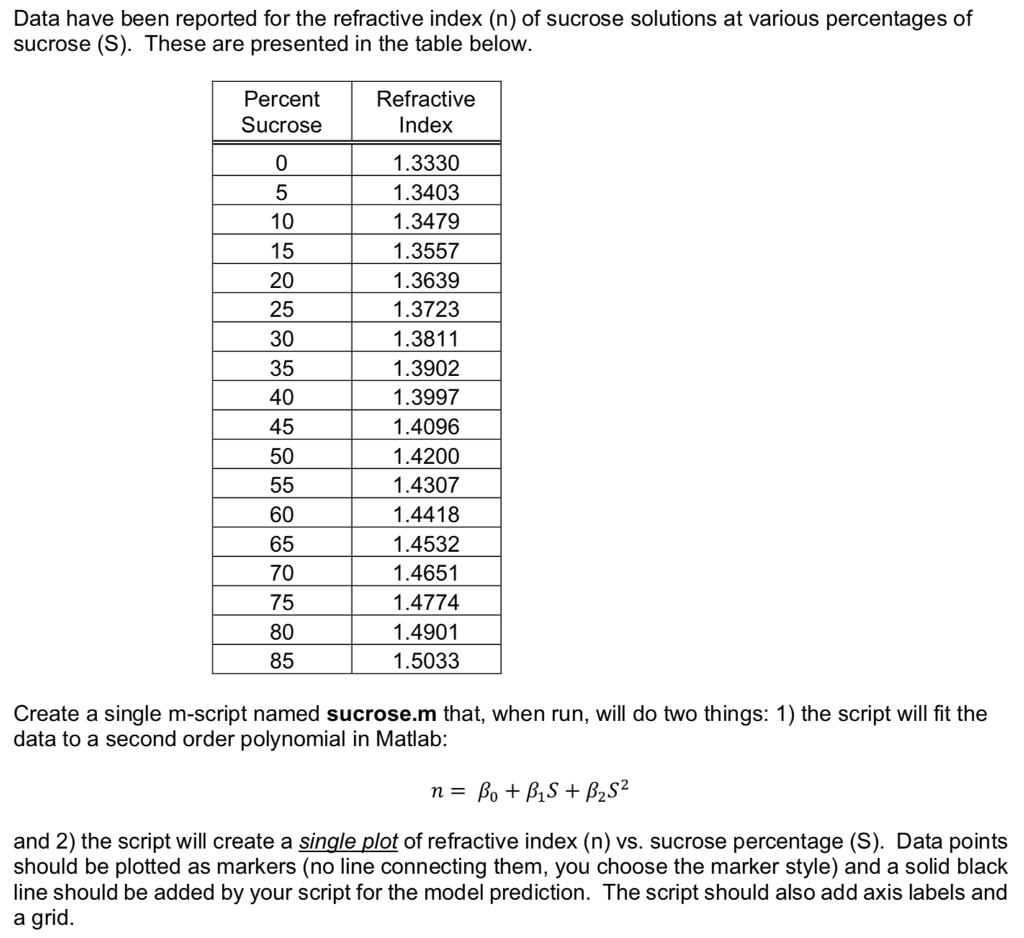
Data have been reported for the refractive index (n) of sucrose solutions at various percentages of sucrose (S). These are presented in the table below Refractive Index 1.3330 1.3403 1.3479 1.3557 1.3639 1.3723 1.3811 1.3902 1.3997 1.4096 1.4200 1.4307 1.4418 1.4532 1.4651 1.4774 1.4901 1.5033 Percent Sucrose 20 25 30 35 40 45 50 60 65 70 75 80 85 Create a single m-script named sucrose.m that, when run, will do two things: 1) the script will fit the data to a second order polynomial in Matiab: and 2) the script will create a single plot of refractive index (n) vs. sucrose percentage (S). Data points should be plotted as markers (no line connecting them, you choose the marker style) and a solid black line should be added by your script for the model prediction. The script should also add axis labels and a grid
Step by Step Solution
There are 3 Steps involved in it

Get step-by-step solutions from verified subject matter experts