

Question: PLEASE SOLVE THIS LINEAR REGRESSION IN C++ This is a class on algorithm, and hence we should not bother with deriving the equations. Here is
PLEASE SOLVE THIS LINEAR REGRESSION IN C++
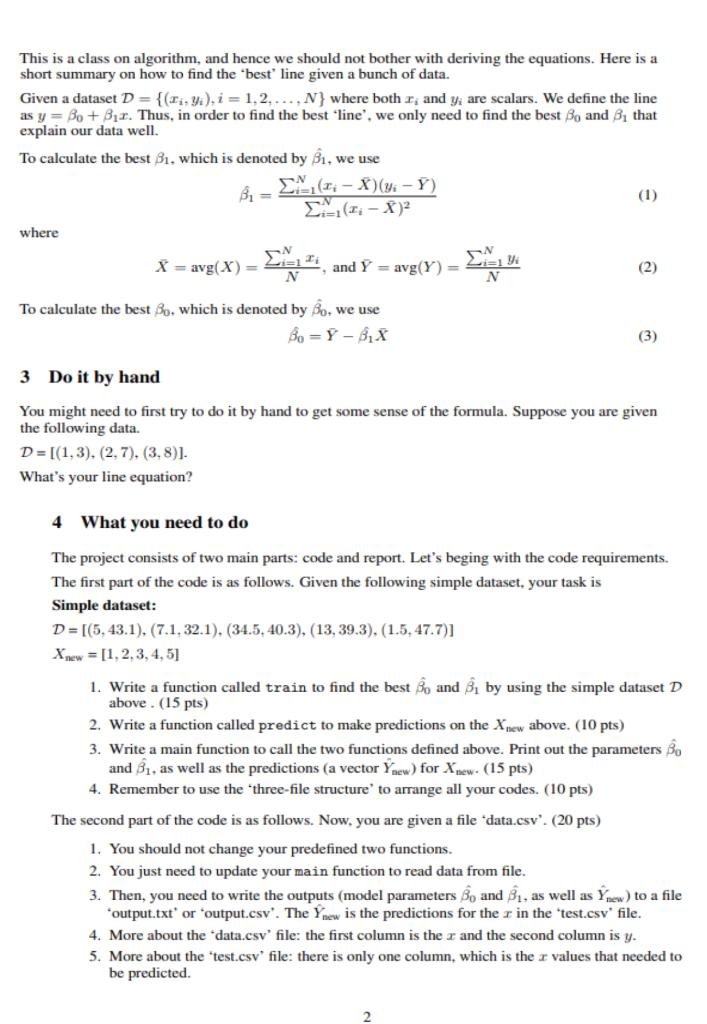
This is a class on algorithm, and hence we should not bother with deriving the equations. Here is a short summary on how to find the 'best' line given a bunch of data. Given a dataset D= {(fi. y.), i = 1,2....,N} where both r, and y, are scalars. We define the line as y = Bo + Bor. Thus, in order to find the best 'line', we only need to find the best Bo and B, that explain our data well. To calculate the best B1, which is denoted by B1. we use Bir EV (I; - x)(y-Y) (1) -(1-X) where X = avg(X) = 6, and Y = avg(Y) = EM (2) To calculate the best Bo, which is denoted by Bo, we use o = (3) 3 Do it by hand You might need to first try to do it by hand to get some sense of the formula. Suppose you are given the following data. D= [(1,3), (2,7), (3.8)]. What's your line equation? 4 What you need to do The project consists of two main parts: code and report. Let's beging with the code requirements. The first part of the code is as follows. Given the following simple dataset, your task is Simple dataset: D= [(5.43.1), (7.1.32.1). (34.5.40.3), (13, 39.3), (1.5, 47.7)] Xnew = [1,2,3,4,5) 1. Write a function called train to find the best Bo and by using the simple dataset D above. (15 pts) 2. Write a function called predict to make predictions on the Xnew above. (10 pts) 3. Write a main function to call the two functions defined above. Print out the parameters Bo and B1, as well as the predictions (a vector Ynew) for Xnew- (15 pts) 4. Remember to use the three-file structure to arrange all your codes. (10 pts) The second part of the code is as follows. Now, you are given a file *data.csv'. (20 pts) 1. You should not change your predefined two functions. 2. You just need to update your main function to read data from file. 3. Then, you need to write the outputs (model parameters Bo and B, as well as Ynew) to a file *output.txt' or 'output.csv'. The Ynew is the predictions for the r in the 'test.csv file. 4. More about the data.csv file: the first column is the r and the second column is y. 5. More about the 'test.csv file: there is only one column, which is the r values that needed to be predicted
Step by Step Solution
There are 3 Steps involved in it

Get step-by-step solutions from verified subject matter experts