

Question: Please solve this on microsoft word and send file not photos please asking for this question from last 8 hours ONO : 1 A secent
Please solve this on microsoft word and send file not photos please asking for this question from last 8 hours
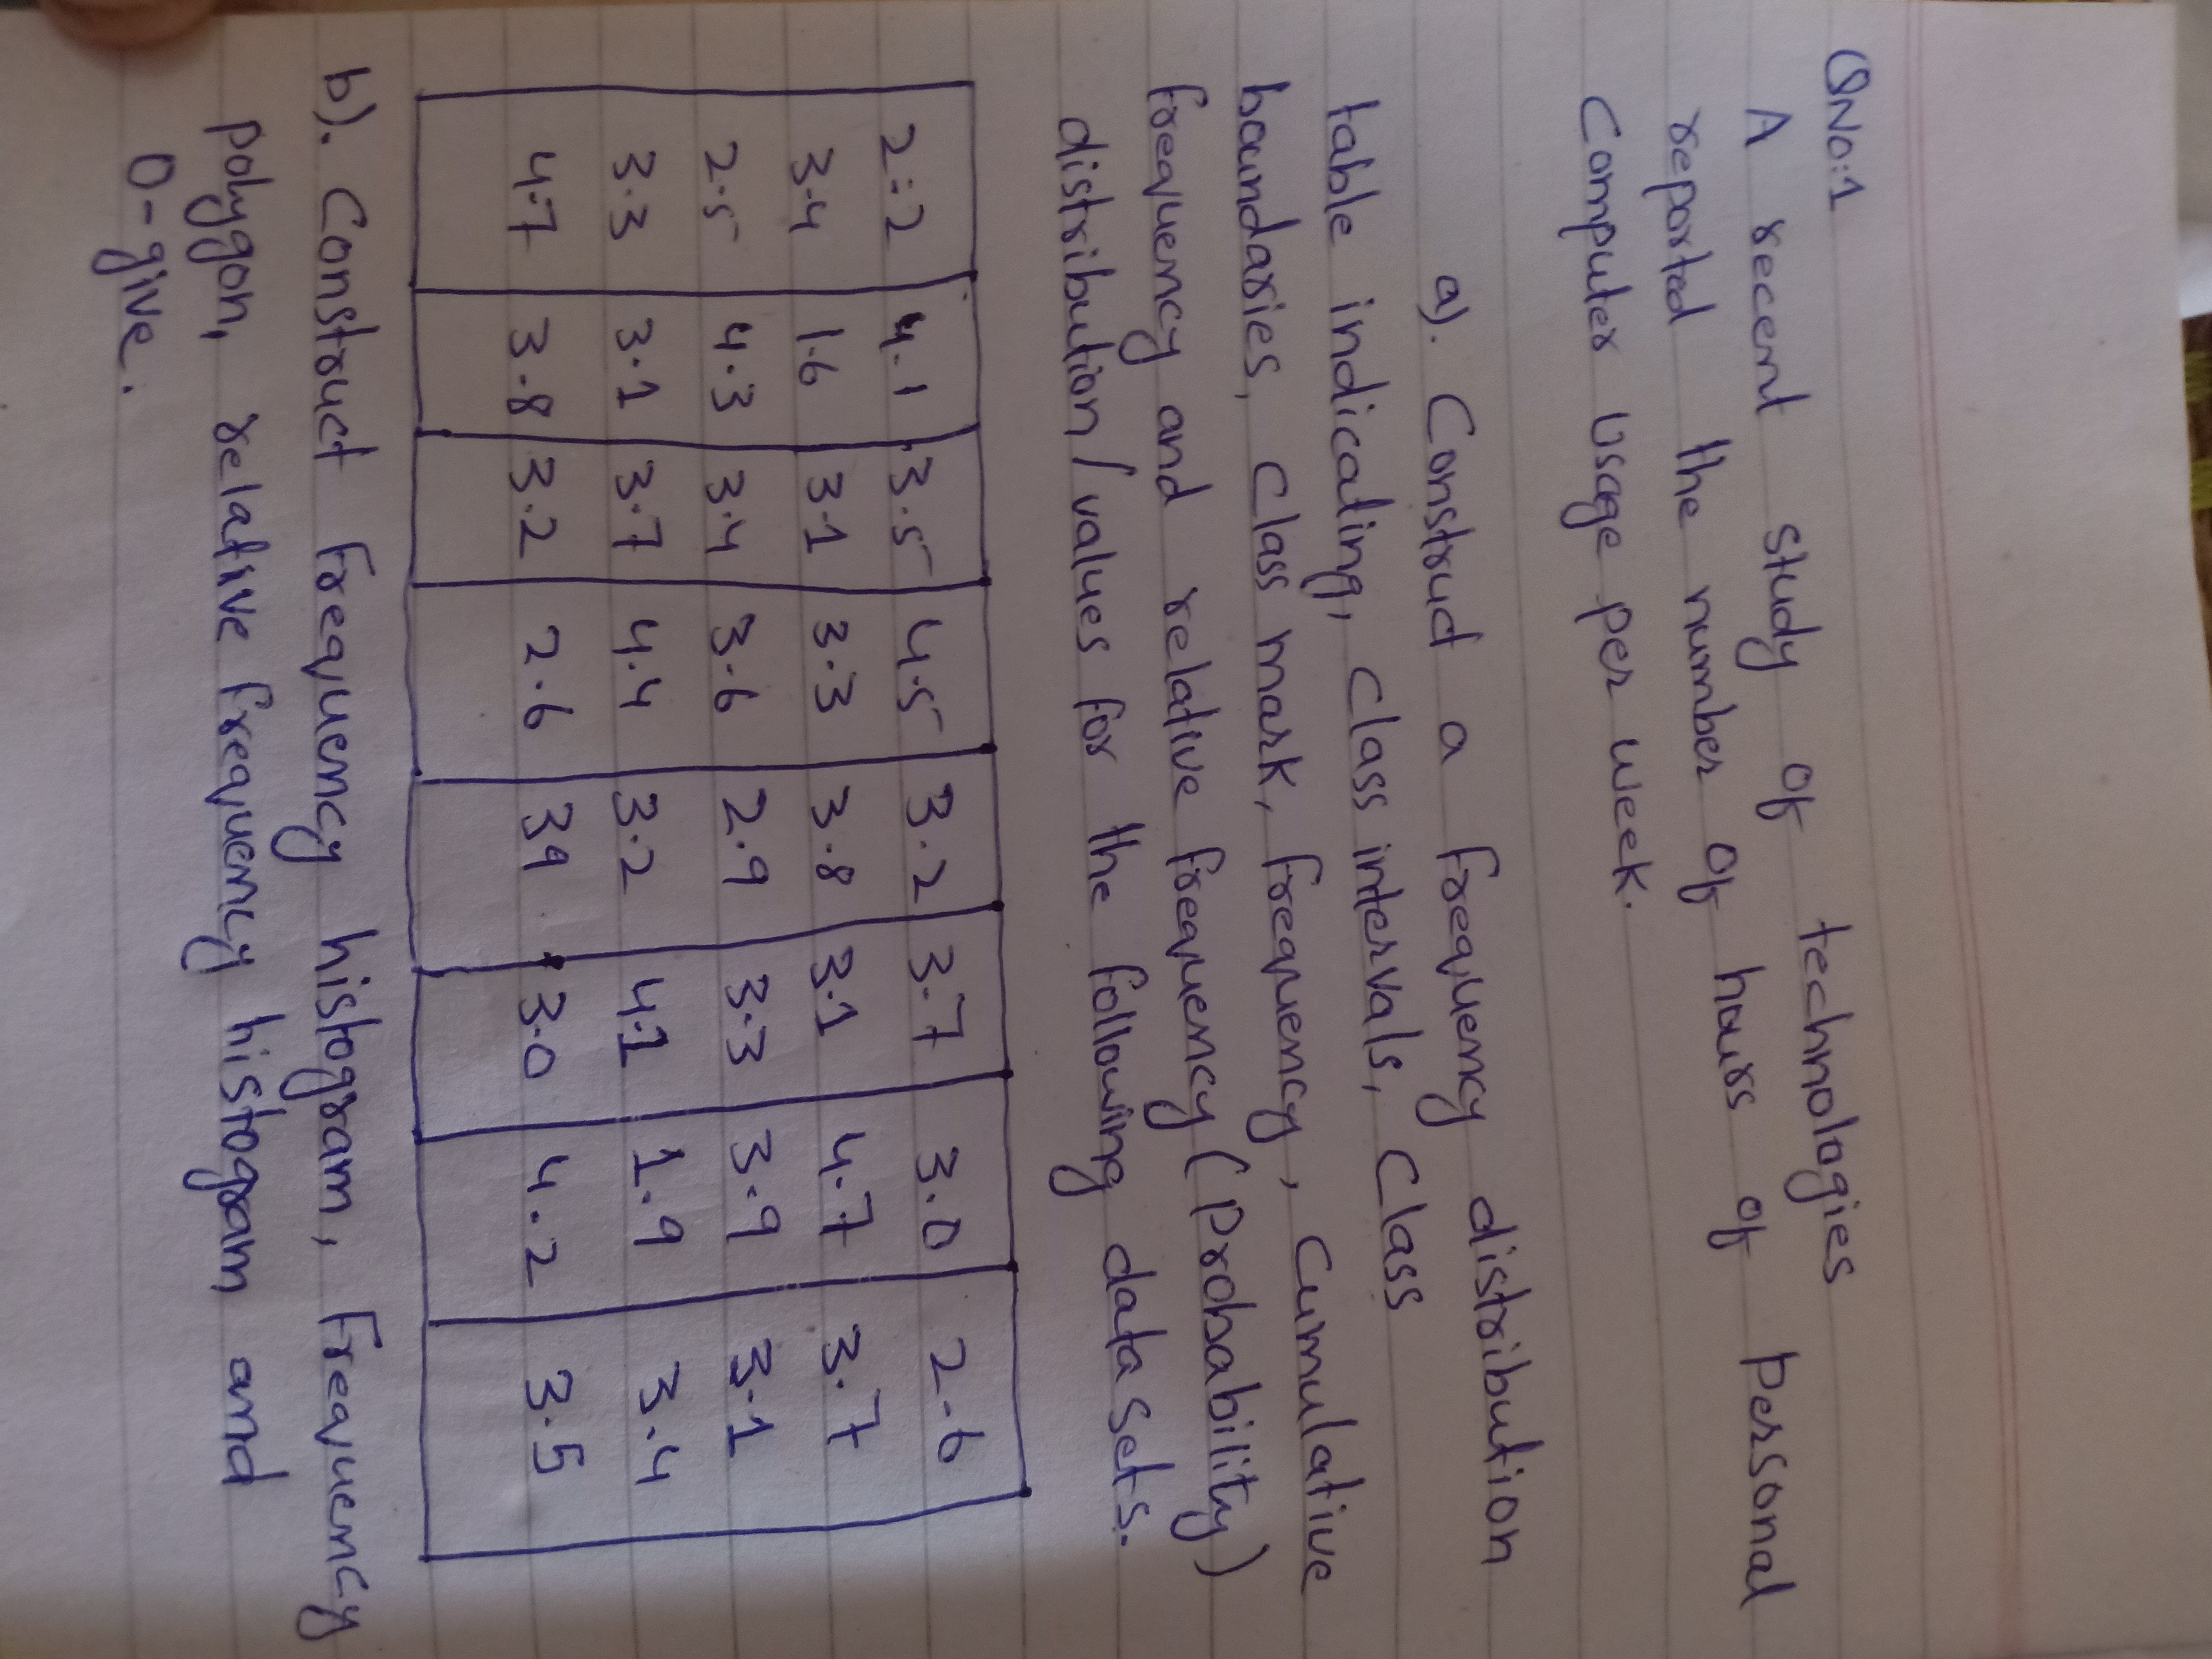
ONO : 1 A secent study of technologies reported the number of hours of Personal Computer Usage per week. a). Construct a frequency distribution table indicating, class intervals, class boundaries , class mark , Frequency , cumulative frequency and relative frequency ( Probability) distribution / values for the following data sets. 2:2 / 4-1 3.5/ 4. 5 3. 2 3- 7 3.0 2- 6 3-4 1 6 3-1 /3 - 3 3 - 8 3.1 4-7 /3.7 2-5 4. 3 3.4 / 3- 6 2.9 3-3 3.9 3 - 1 3.3 /3 . 1 /3.7 /4.4 3.2 41 1. 9 3 .4 4-7 /3- 8/ 3.2 2.6 39 $3-0 4. 2 3.5 b). Construct Frequency histogram, Frequency polygon, relative frequency histogram and 0 - give
Step by Step Solution
There are 3 Steps involved in it

Get step-by-step solutions from verified subject matter experts