

Question: please solve this problem use excel scenario manager Of course you re the range of potential and maximums. alize that you may be wrong, in
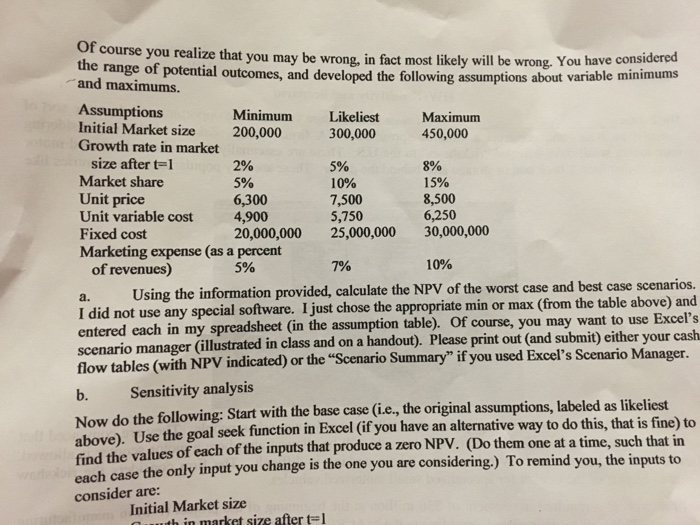
Of course you re the range of potential and maximums. alize that you may be wrong, in fact most likely will be wrong. You have considered outcomes, and developed the following assumptions about variable minimums Assumptions Initial Market size Growth rate in market Minimum 200,000 Likeliest450,000 300,000 Maximum size after t-1 Market share Unit price Unit variable cost 4,900 Fixed cost Marketing expense (as a percent 2% 5% 5% 10% 7,500 5,750 8% 15% 8,500 6,250 6,300 20,000,000 25,000,000 30,000,000 5% 7% 10% of revenues) a. Using the information provided, calculate the NPV of the worst case and best case scenarios. I did not entered each in my spreadsheet (in the assumption table). O scenario manager (illustrated in class and on a handout). Please print out (and submit) either your cash t use any special software. I just chose the appropriate min or max (from the table above) and f course, you may want to use Excel's Summary" if you used Excel's Scenario Manager. b. Sensitivity analysis Now do the following: Start with the base case (i.e, the original assumptions, labeled as likeliest above). Use the goal seek function in Excel (if you hav find the values of each of the inputs that produce a zero NPV. (Do them one at a time, such that in each case the only input you change is the one you are considering.) To remind you, the inputs to e an alternative way to do this, that is fine) to consider are: Initial Market size th in market size after tl Of course you re the range of potential and maximums. alize that you may be wrong, in fact most likely will be wrong. You have considered outcomes, and developed the following assumptions about variable minimums Assumptions Initial Market size Growth rate in market Minimum 200,000 Likeliest450,000 300,000 Maximum size after t-1 Market share Unit price Unit variable cost 4,900 Fixed cost Marketing expense (as a percent 2% 5% 5% 10% 7,500 5,750 8% 15% 8,500 6,250 6,300 20,000,000 25,000,000 30,000,000 5% 7% 10% of revenues) a. Using the information provided, calculate the NPV of the worst case and best case scenarios. I did not entered each in my spreadsheet (in the assumption table). O scenario manager (illustrated in class and on a handout). Please print out (and submit) either your cash t use any special software. I just chose the appropriate min or max (from the table above) and f course, you may want to use Excel's Summary" if you used Excel's Scenario Manager. b. Sensitivity analysis Now do the following: Start with the base case (i.e, the original assumptions, labeled as likeliest above). Use the goal seek function in Excel (if you hav find the values of each of the inputs that produce a zero NPV. (Do them one at a time, such that in each case the only input you change is the one you are considering.) To remind you, the inputs to e an alternative way to do this, that is fine) to consider are: Initial Market size th in market size after tl
Step by Step Solution
There are 3 Steps involved in it

Get step-by-step solutions from verified subject matter experts