

Question: Please solve this problem: Use the data on US and Boston rates available in attached image: Boston Unemployment Rate ( Column B ) US Unemployment
Please solve this problem:
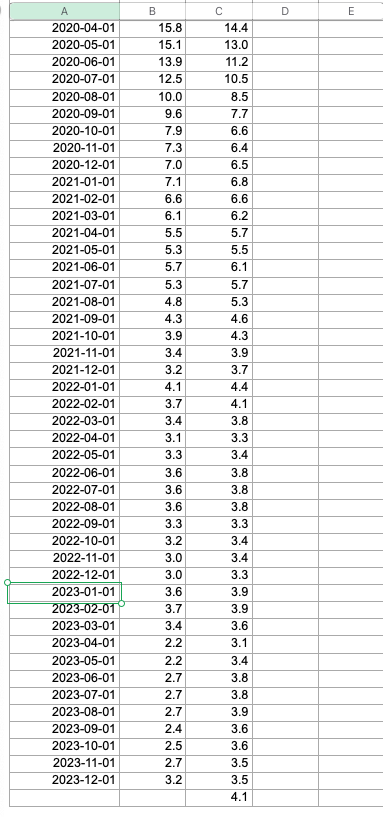
Use the data on US and Boston rates available in attached image:Boston Unemployment Rate Column BUS Unemployment Rate Column C Develop a forecast for both unemployment rates for January Boston and February United StatesYou must test at least three different forecasting methods no more than two iterations of a same method eg you can do month and month Moving Average, but you must test at least one other method Pick the one you think is the best, and explain why you picked it Provide the forecast unemployment rate for March for US and January for Boston. Does the forecast "make sense" to you?At the very least you should answer the following questions: Which criteria you used to choose the forecast eg RMSE, MAD, etc. How did different models perform on this criteria ie report actual numbers What was the forecast of each model? What is your final forecast based on the models Do you think it is an underestimate, overestimate or fairly reasonable? If you think the rate would be something other than what your method produces, what is your predicted unemployment rate for each? Explain your choice.
What is your final forecast using the models andor your subjective judgment to two decimal points eg for February Boston and March USie one month later than your forecast above Most accurate forecast not going over the actual rate in a case of a tie will receive a prize once the actual February BostonMarch US unemployment if announced by the Bureau of Labor Statistics.
Step by Step Solution
There are 3 Steps involved in it
1 Expert Approved Answer
Step: 1 Unlock

Question Has Been Solved by an Expert!
Get step-by-step solutions from verified subject matter experts
Step: 2 Unlock
Step: 3 Unlock