

Question: please solve this problem with R tool. Problem 1. Complete the following problems for the sample of two variables (X, Y). (0.2, 1.1), (1.2, 2.3),
please solve this problem with R tool.
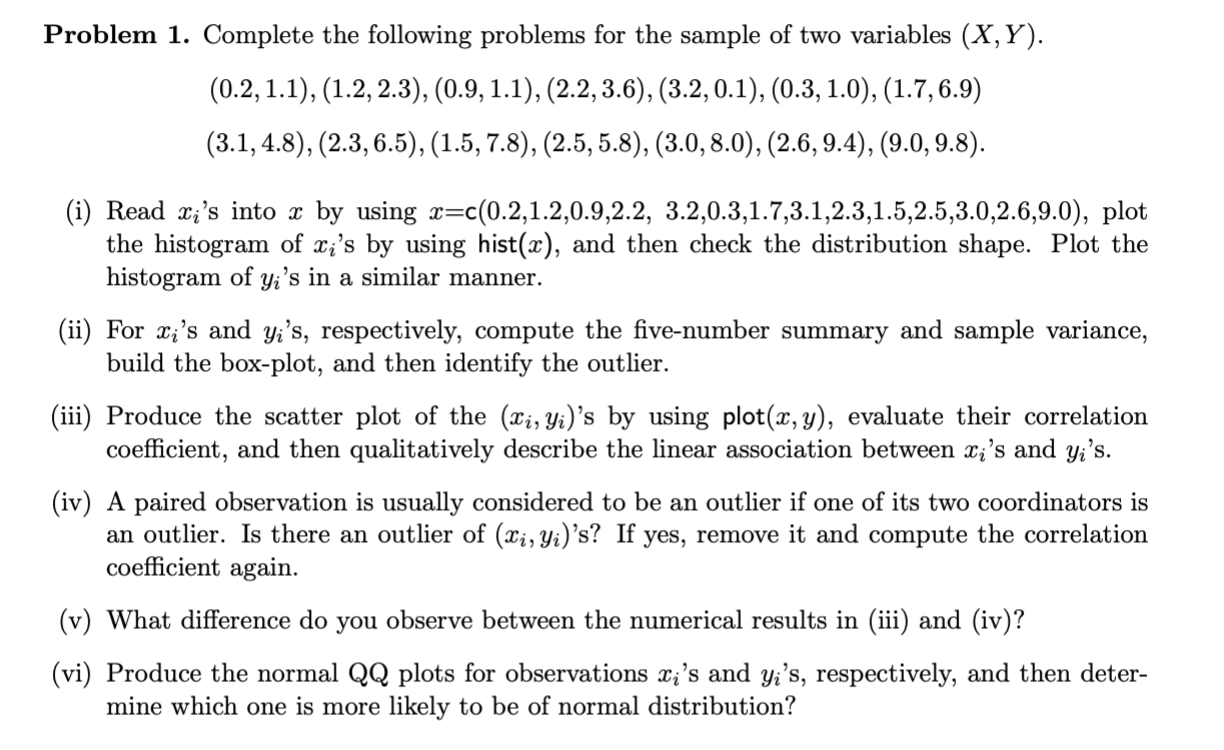
Problem 1. Complete the following problems for the sample of two variables (X, Y). (0.2, 1.1), (1.2, 2.3), (0.9, 1.1), (2.2, 3.6), (3.2, 0.1), (0.3, 1.0), (1.7, 6.9) (3.1, 4.8), (2.3, 6.5), (1.5, 7.8), (2.5, 5.8), (3.0, 8.0), (2.6, 9.4), (9.0, 9.8). (1) Read mg's into a: by using a:=c(0.2,1.2,0.9,2.2, 3.2,0.3,1.7,3.1,2.3,1.5,2.5,3.0,2.6,9.0), plot the histogram of 33's by using hist(:r), and then check the distribution shape. Plot the histogram of yg's in a similar manner. (ii) For 33's and yi's, respectively, compute the ve-number summary and sample variance, build the box-plot, and then identify the outlier. (iii) Produce the scatter plot of the (mg,y;)'s by using plot(a:,y), evaluate their correlation coefficient, and then qualitatively describe the linear association between 51:53 and yi's. (iv) A paired observation is usually considered to be an outlier if one of its two coordinators is an outlier. Is there an outlier of (mi, yg)'s? If yes, remove it and compute the correlation coe'icient again. (v) What difference do you observe between the numerical results in (iii) and (iv)? (vi) Produce the normal QQ plots for observations 33's and 3:38, respectively, and then deter- mine which one is more likely to be of normal distribution
Step by Step Solution
There are 3 Steps involved in it

Get step-by-step solutions from verified subject matter experts