

Question: please solve this QUESTION 3 form: The demand for beef is to be estimated using a log-linear equation of the log QB = a+ B1
please solve this
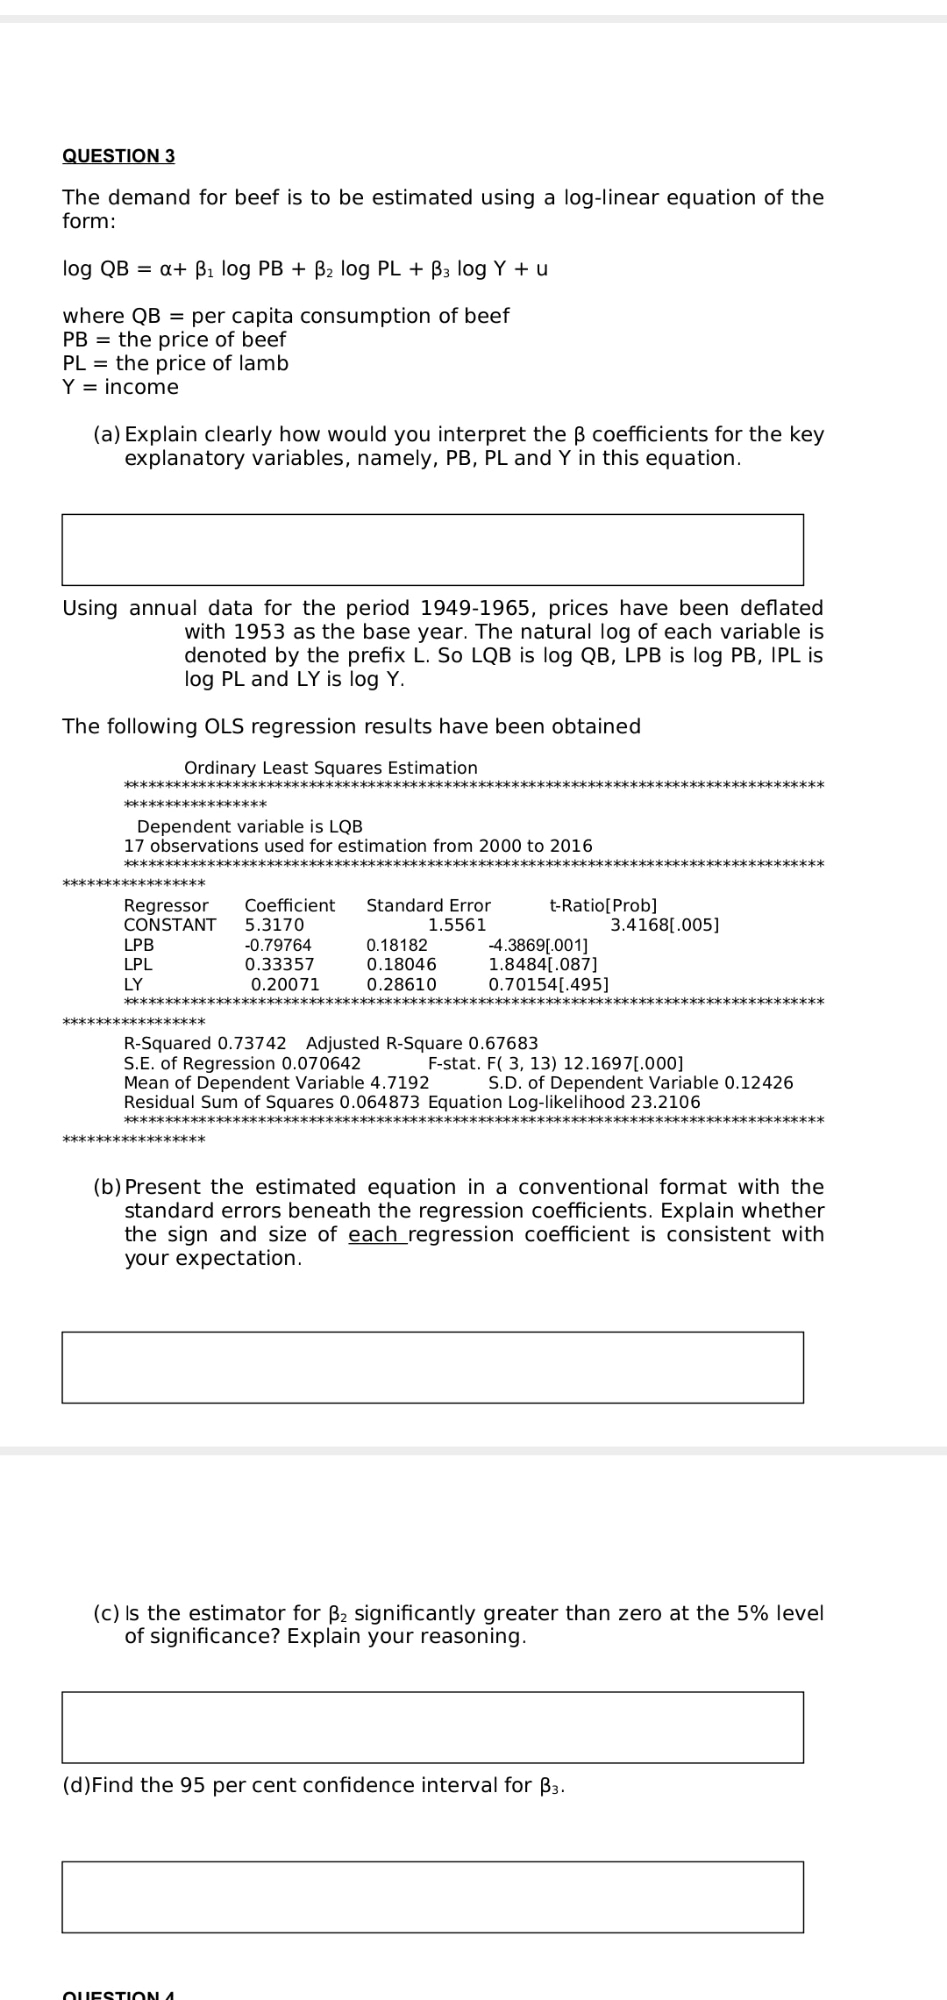
QUESTION 3 form: The demand for beef is to be estimated using a log-linear equation of the log QB = a+ B1 log PB + B2 log PL + B3 log Y + u where QB = per capita consumption of beef PB = the price of beef PL = the price of lamb Y = income (a) Explain clearly how would you interpret the B coefficients for the key explanatory variables, namely, PB, PL and Y in this equation. Using annual data for the period 1949-1965, prices have been deflated with 1953 as the base year. The natural log of each variable is denoted by the prefix L. So LQB is log QB, LPB is log PB, IPL is log PL and LY is log Y. The following OLS regression results have been obtained Ordinary Least Squares Estimation *0** ** ** * * * * * * * * * * * * * * * * * * * * * * * * * * * * * * * * * * * * * * * * * * * * * * * * * * * * * * ** * ** * ** ****** ******** ** * * * ****** ****** Dependent variable is LQB 17 observations used for estimation from 2000 to 2016 * * * * * * * * * * * * * * * * * * * * * * * * * * * * * * * * * * * * * * * * * * * * * * * * * * * * * * * * * * * * * * * * * * * * * * * * * * * * * * * * * ** ************* Regressor Coefficient Standard Error t-Ratio[Prob] CONSTANT 5.3170 1.5561 3.4168[.005] LPB -0.79764 0.18182 4.3869[.001] LPL 0.33357 0.18046 1.8484[.087] LY 0.20071 0.28610 0.70154[.495] ***************** R-Squared 0.73742 Adjusted R-Square 0.67683 S.E. of Regression 0.070642 F-stat. F( 3, 13) 12.1697[.000] Mean of Dependent Variable 4.7192 S.D. of Dependent Variable 0.12426 Residual Sum of Squares 0.064873 Equation Log-likelihood 23.2106 *0* * * * * * * * * * * * * * * * * * * * * * * * * * * * * * * * * * * * * * * * * * * * * * * * * * * * * * * * * * * * * * * * * * * * * * * * * * ******* ***************** (b) Present the estimated equation in a conventional format with the standard errors beneath the regression coefficients. Explain whether the sign and size of each regression coefficient is consistent with your expectation. (c) Is the estimator for B2 significantly greater than zero at the 5% level of significance? Explain your reasoning. (d) Find the 95 per cent confidence interval for B3
Step by Step Solution
There are 3 Steps involved in it

Get step-by-step solutions from verified subject matter experts