

Question: Please solve this question for me and send me the detailed explanation for each part. Thank you. The following diagram shows the aggregate expenditure schedule
Please solve this question for me and send me the detailed explanation for each part.
Thank you.
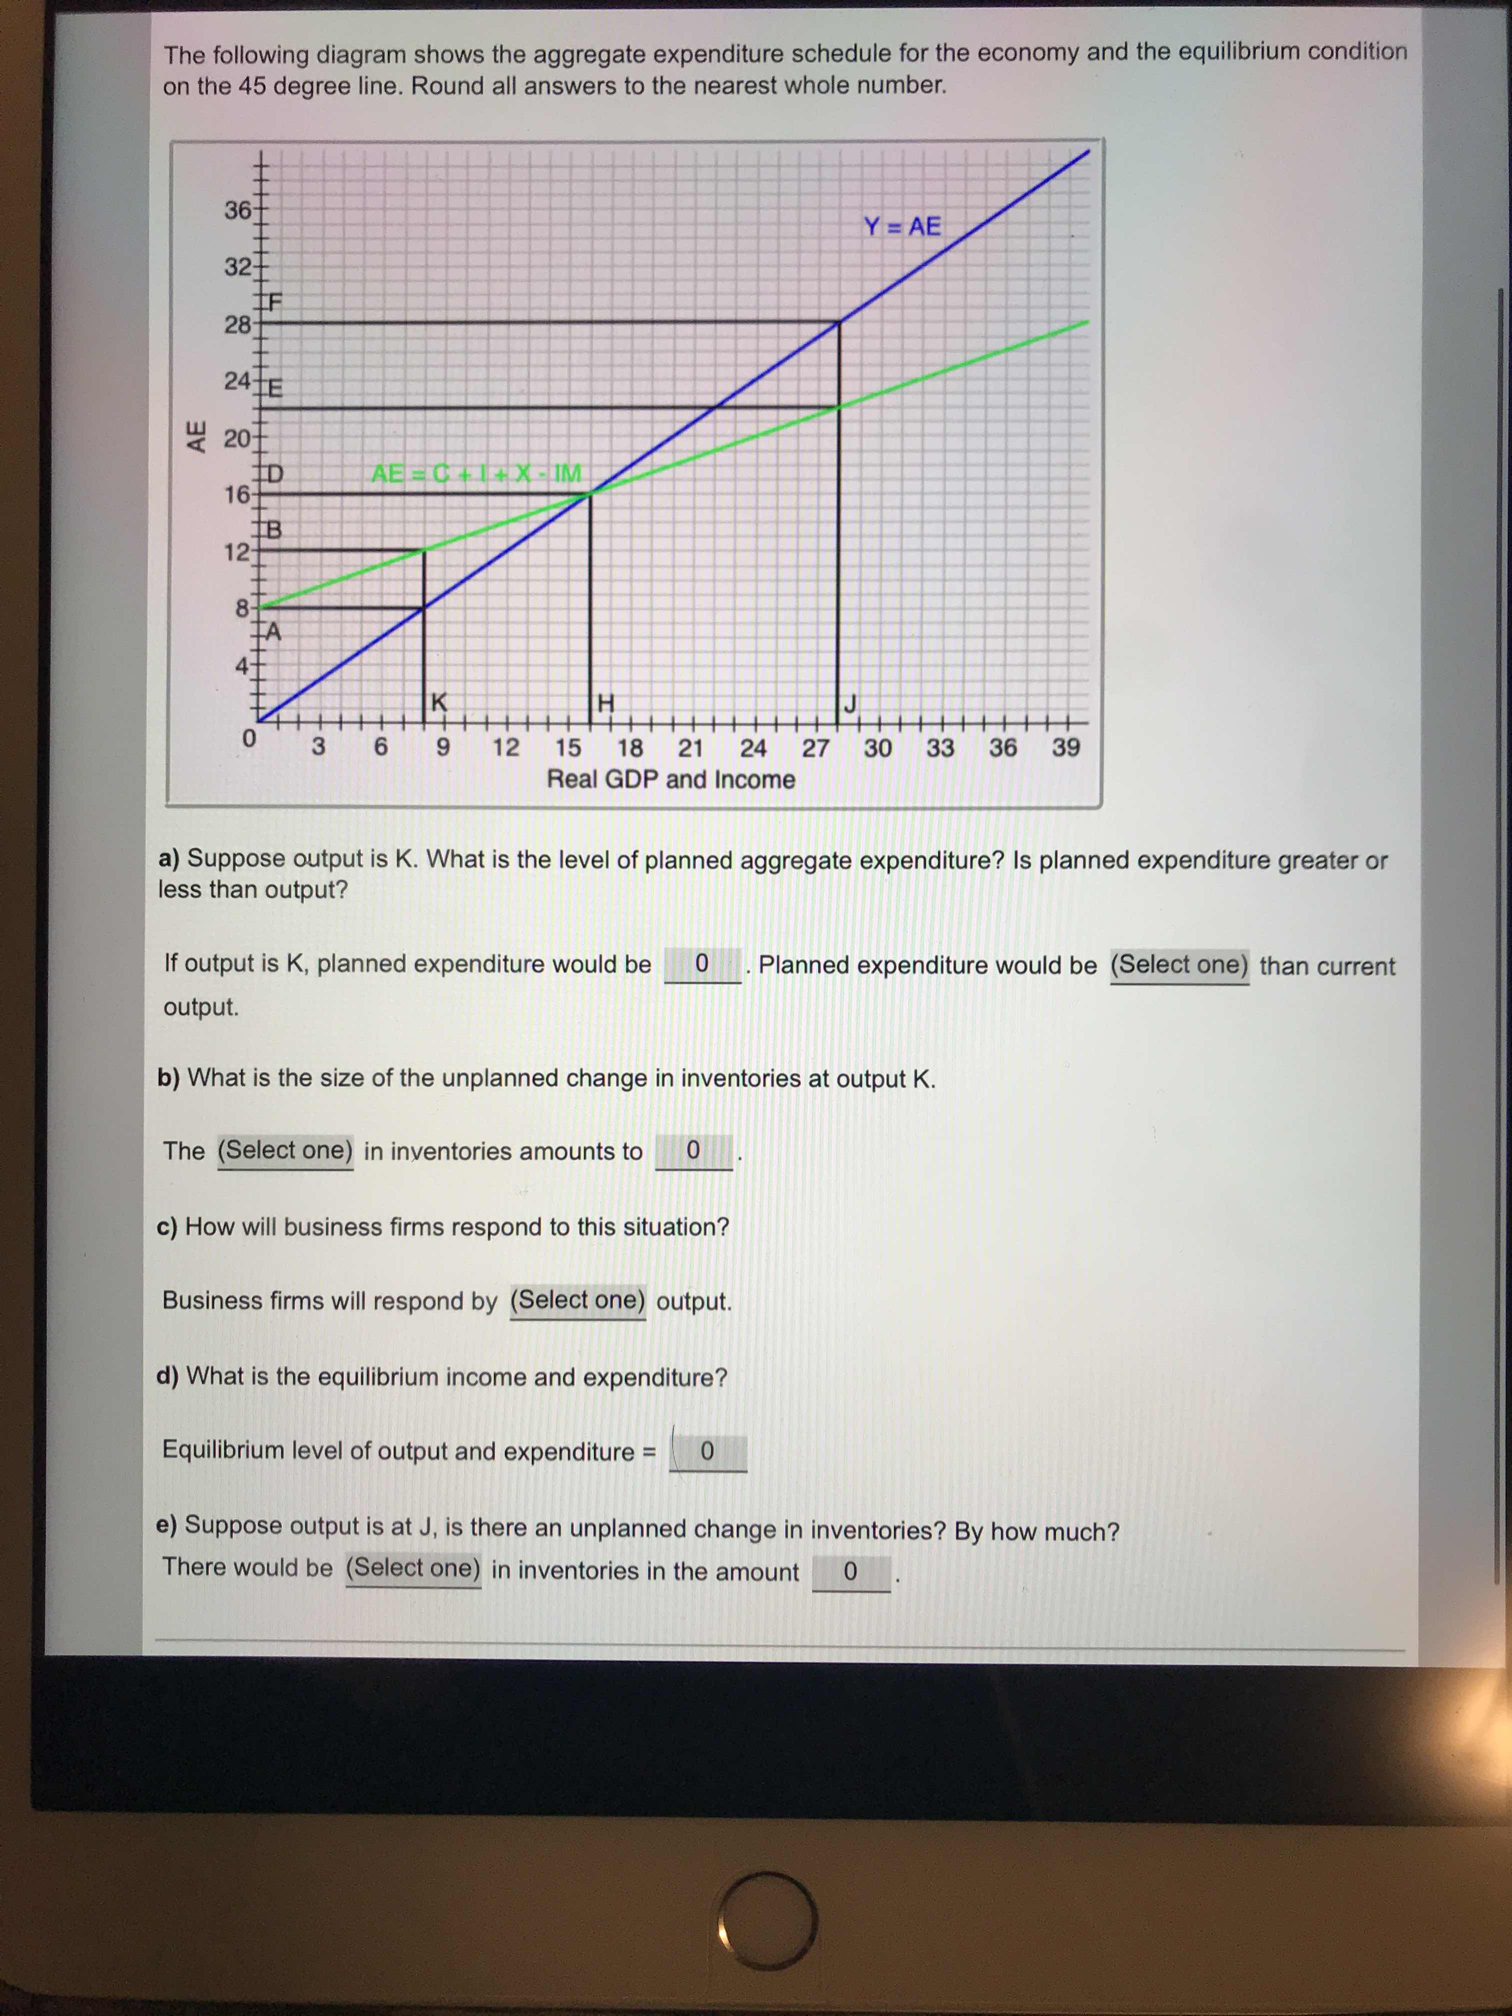
The following diagram shows the aggregate expenditure schedule for the economy and the squilib urn\": . on the 45 degree line. Round all answers to the nearest whole number. - ., 12 15 1a 21 24 27 30 33 36 39 Real GDP and Income a) Suppose output is K. What is the level of planned aggregate expenditure? ls planned expenditure greater or less than output? If output is K, planned expenditure would be 0 . Planned expenditure would be (Select one) than current output. [1) What is the size of the unplanned change in inventories at output K. The (elect one) in inventories amounts to 0 c) How will business firms respond to this situation? Business firms will respond by (Select one) output. d) What is the equilibrium income and expenditure? Equilibrium level of output and expenditure = l 0 e) Suppose output Is at J. ls there an unplanned change In Inventories? By how much? There Would be wells.) in inventories In the amount 0
Step by Step Solution
There are 3 Steps involved in it

Get step-by-step solutions from verified subject matter experts