

Question: Please solve this question using excel and show the excel answers. Please give the detailed answers as I need to understand the question. Please help
Please solve this question using excel and show the excel answers. Please give the detailed answers as I need to understand the question. Please help for my assignment. No one is giving me the correct answer. Please try to post the how you solve it in excel.
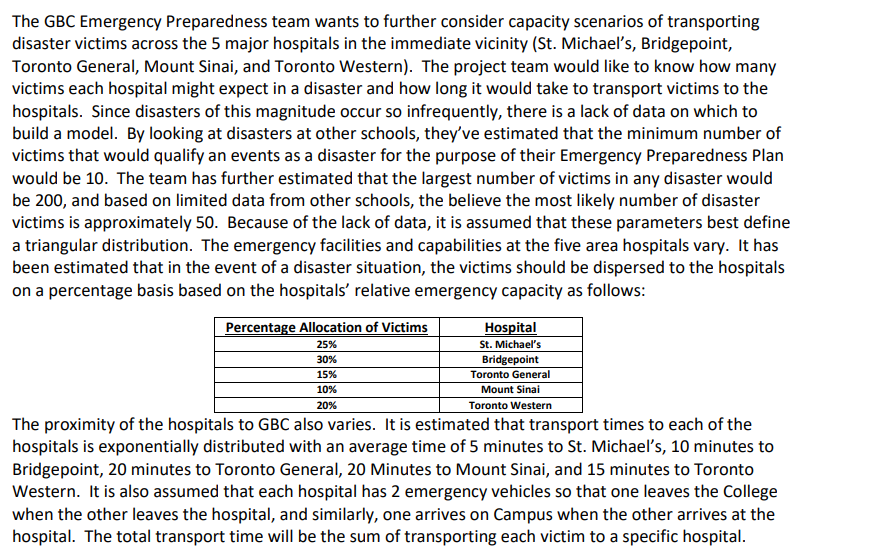
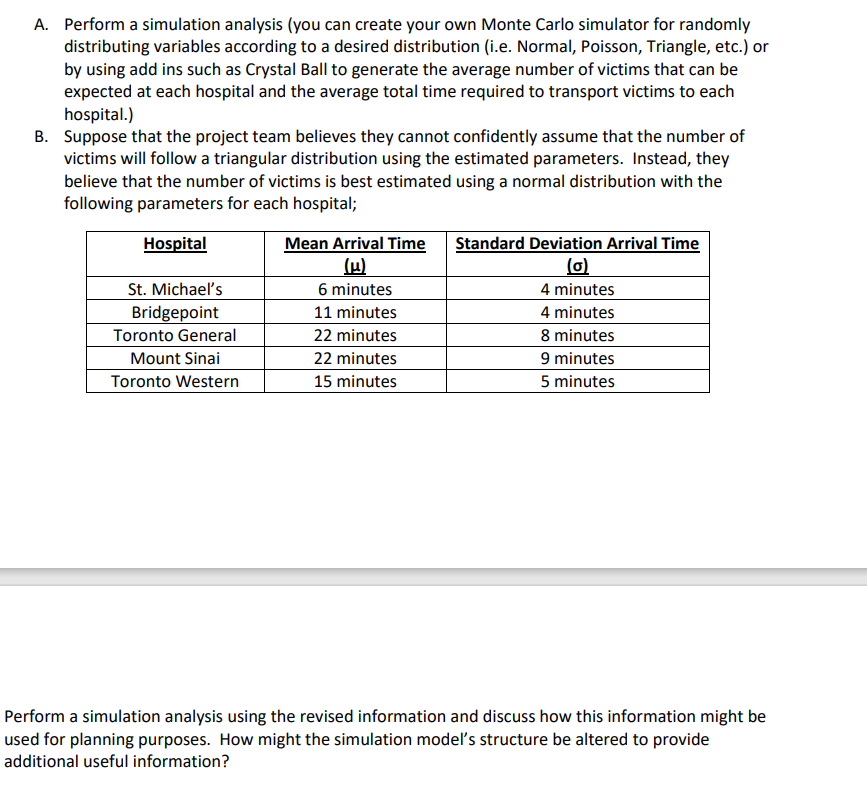
The GBC Emergency Preparedness team wants to further consider capacity scenarios of transporting disaster victims across the 5 major hospitals in the immediate vicinity (St. Michael's, Bridgepoint, Toronto General, Mount Sinai, and Toronto Western). The project team would like to know how many victims each hospital might expect in a disaster and how long it would take to transport victims to the hospitals. Since disasters of this magnitude occur so infrequently, there is a lack of data on which to build a model. By looking at disasters at other schools, they've estimated that the minimum number of victims that would qualify an events as a disaster for the purpose of their Emergency Preparedness Plan would be 10 . The team has further estimated that the largest number of victims in any disaster would be 200 , and based on limited data from other schools, the believe the most likely number of disaster victims is approximately 50 . Because of the lack of data, it is assumed that these parameters best define a triangular distribution. The emergency facilities and capabilities at the five area hospitals vary. It has been estimated that in the event of a disaster situation, the victims should be dispersed to the hospitals on a percentage basis based on the hospitals' relative emergency capacity as follows: The proximity of the hospitals to GBC also varies. It is estimated that transport times to each of the hospitals is exponentially distributed with an average time of 5 minutes to St. Michael's, 10 minutes to Bridgepoint, 20 minutes to Toronto General, 20 Minutes to Mount Sinai, and 15 minutes to Toronto Western. It is also assumed that each hospital has 2 emergency vehicles so that one leaves the College when the other leaves the hospital, and similarly, one arrives on Campus when the other arrives at the hospital. The total transport time will be the sum of transporting each victim to a specific hospital. A. Perform a simulation analysis (you can create your own Monte Carlo simulator for randomly distributing variables according to a desired distribution (i.e. Normal, Poisson, Triangle, etc.) or by using add ins such as Crystal Ball to generate the average number of victims that can be expected at each hospital and the average total time required to transport victims to each hospital.) B. Suppose that the project team believes they cannot confidently assume that the number of victims will follow a triangular distribution using the estimated parameters. Instead, they believe that the number of victims is best estimated using a normal distribution with the following parameters for each hospital; Perform a simulation analysis using the revised information and discuss how this information might be used for planning purposes. How might the simulation model's structure be altered to provide additional useful information
Step by Step Solution
There are 3 Steps involved in it

Get step-by-step solutions from verified subject matter experts