

Question: please solve this question using Excel. I provide all materials that about this question. including (BSCall.txt) ,exercise 1 ,text page 429 and 428 . The
please solve this question using Excel. I provide all materials that about this question. including (BSCall.txt) ,exercise 1 ,text page 429 and 428 . The following text is BSCall.txt
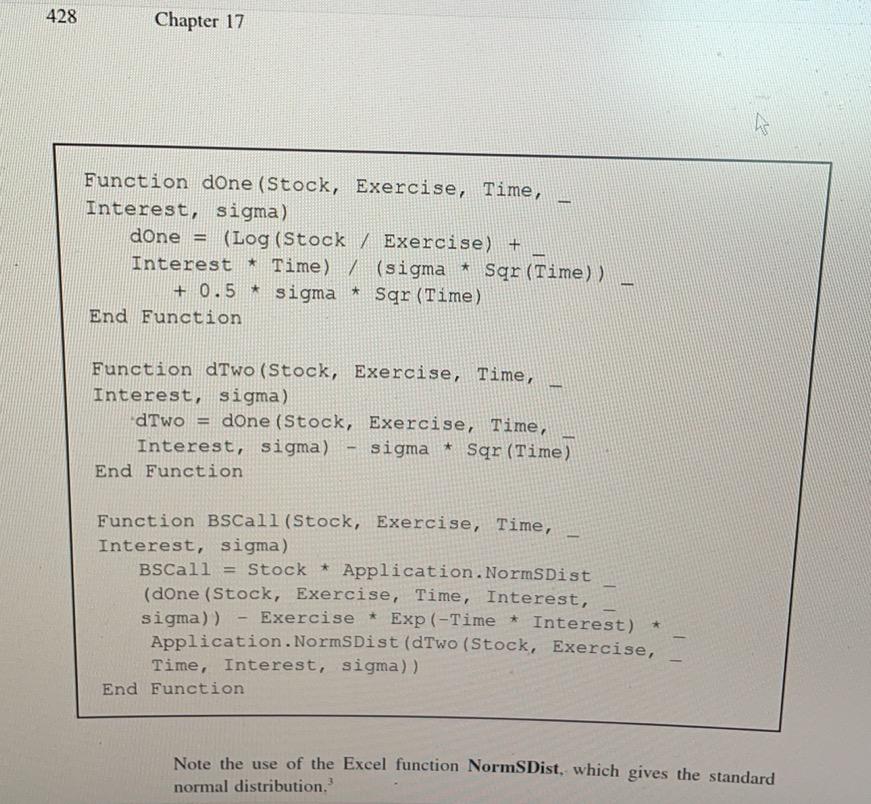
Function dOne(Stock, Exercise, Time, Interest, sigma) dOne = (Log(Stock / Exercise) + Interest * Time) / (sigma * Sqr(Time)) _ + 0.5 * sigma * Sqr(Time) End Function
Function BSCall(Stock, Exercise, Time, Interest, sigma) BSCall = Stock * Application.NormSDist(dOne(Stock, Exercise, _ Time, Interest, sigma)) - Exercise * Exp(-Time * Interest) * _ Application.NormSDist(dOne(Stock, Exercise, Time, Interest, sigma) _ - sigma * Sqr(Time)) End Function 'Put pricing function uses put-call parity theorem Function BSPut(Stock, Exercise, Time, Interest, sigma) If Stock = 0 Then BSPut = Exercise Else: BSPut = BSCall(Stock, Exercise, Time, Interest, sigma) _ + Exercise * Exp(-Interest * Time) - Stock End If End Function
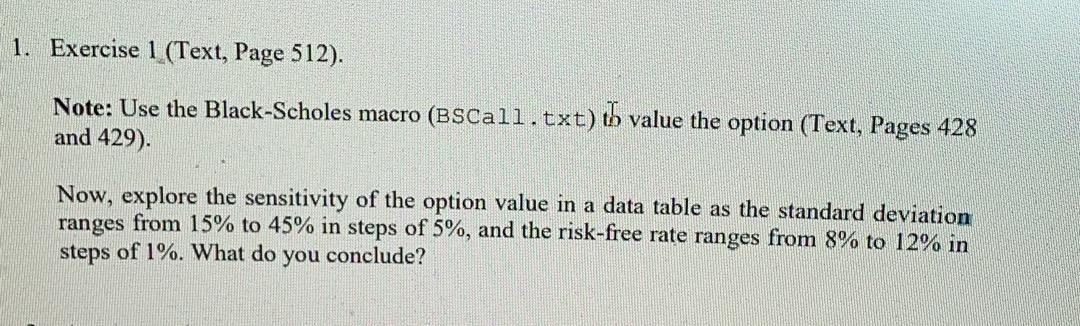
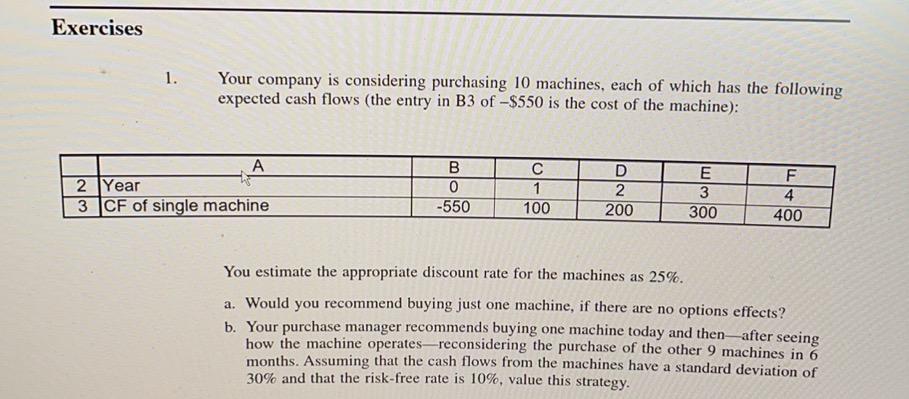
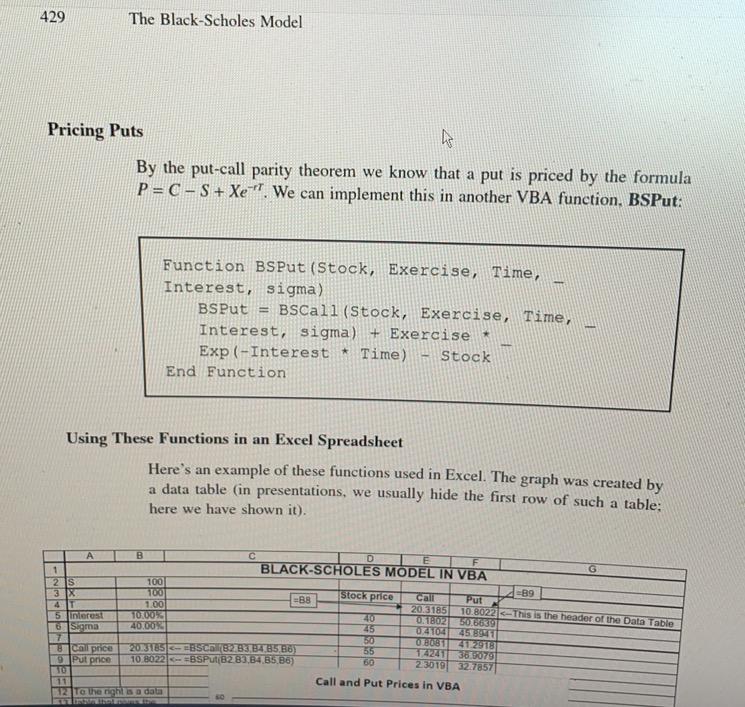
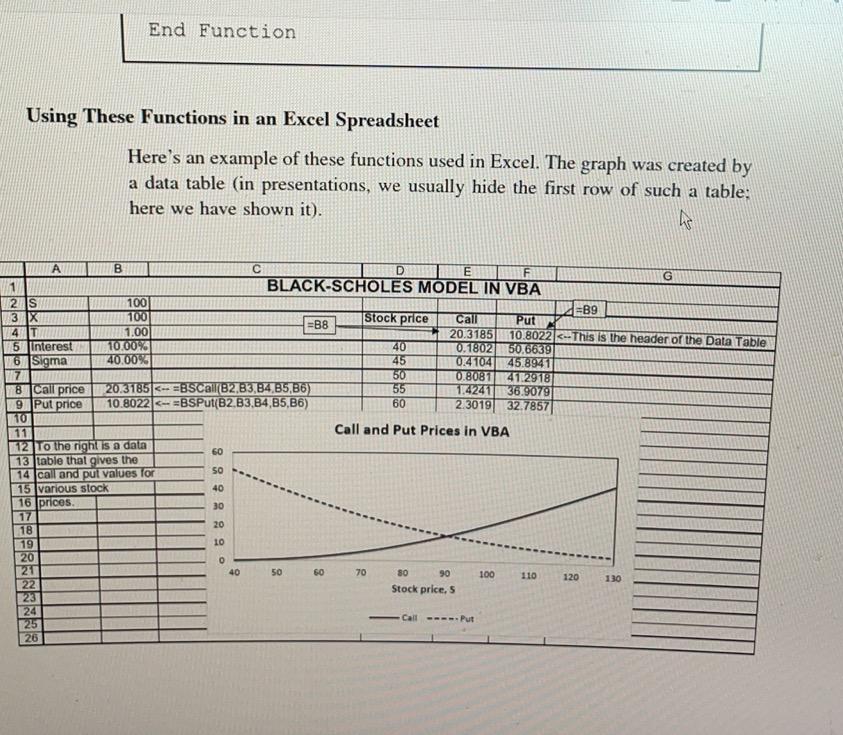
1. Exercise 1 (Text, Page 512). Note: Use the Black-Scholes macro (BSCall.txt) to value the option (Text, Pages 428 and 429). Now, explore the sensitivity of the option value in a data table as the standard deviation ranges from 15% to 45% in steps of 5%, and the risk-free rate ranges from 8% to 12% in steps of 1%. What do you conclude? Exercises 1. Your company is considering purchasing 10 machines, each of which has the following expected cash flows (the entry in B3 of -$550 is the cost of the machine): A 2 Year 3 CF of single machine B 0 -550 1 100 D 2 200 E 3 300 F 4 400 You estimate the appropriate discount rate for the machines as 25%. a. Would you recommend buying just one machine, if there are no options effects? b. Your purchase manager recommends buying one machine today and then after seeing how the machine operates-reconsidering the purchase of the other 9 machines in 6 months. Assuming that the cash flows from the machines have a standard deviation of 30% and that the risk-free rate is 10%, value this strategy. 428 Chapter 17 h Function done (Stock, Exercise, Time, Interest, sigma) done = (Log (Stock / Exercise) + Interest * Time) / (sigma * Sqr (Time)) + 0.5 * sigma Sqr (Time) End Function * Function dTwo (Stock, Exercise, Time, Interest, sigma) dTwo = done (Stock, Exercise, Time, Interest, sigma) sigma Sqr (Time) End Function * Function BSCall (Stock, Exercise, Time, Interest, sigma) BSCall Stock * Application.NormSDist (done (Stock, Exercise, Time, Interest, sigma)) - Exercise * Exp(-Time * Interest) Application. NormSDist (dTwo (Stock, Exercise, Time, Interest, sigma)) End Function Note the use of the Excel function NormSDist, which gives the standard normal distribution.' 429 The Black-Scholes Model Pricing Puts By the put-call parity theorem we know that a put is priced by the formula P =C-S + Xe ". We can implement this in another VBA function. BSPut: Function BSPut (Stock, Exercise, Time, Interest, sigma) BSPut = BSCall (Stock, Exercise, Time, Interest, sigma) + Exercise * Exp(-Interest - Time) Stock End Function Using These Functions in an Excel Spreadsheet Here's an example of these functions used in Excel. The graph was created by a data table (in presentations, we usually hide the first row of such a table: here we have shown it). Stock price B D 1 BLACK-SCHOLES MODEL IN VBA G 2 S 100 3 X 100 -89 Call =B8 Put 4 1.00 20.3185 10.8022-This is the header of the Data Table 5 Interest TO2007 20 0.1802 5016680 Sigma 40.00 25 074 104 45.8941 7 O087 2512918 call price 2013165 BSCB2 B3 B4 B5 B6) 55 174241 3653079 Put price 10. 8022 BSPUB2B3,B4.85.36) 23019327857 TO 11 Call and Put Prices in VBA 12 to the right sa data End Function Using These Functions in an Excel Spreadsheet Here's an example of these functions used in Excel. The graph was created by a data table (in presentations, we usually hide the first row of such a table: here we have shown it). A B D E F G BLACK-SCHOLES MODEL IN VBA 2 IS 100 =B9 3 X 100 Stock price =B8 Call Put 4IT 1.00 20.3185 10.8022
Step by Step Solution
There are 3 Steps involved in it

Get step-by-step solutions from verified subject matter experts