

Question: Please solve this question using Excel sheet Q 1 The marketing manager of a transportation network company offering taxi services in a metro city wanted


Please solve this question using Excel sheet
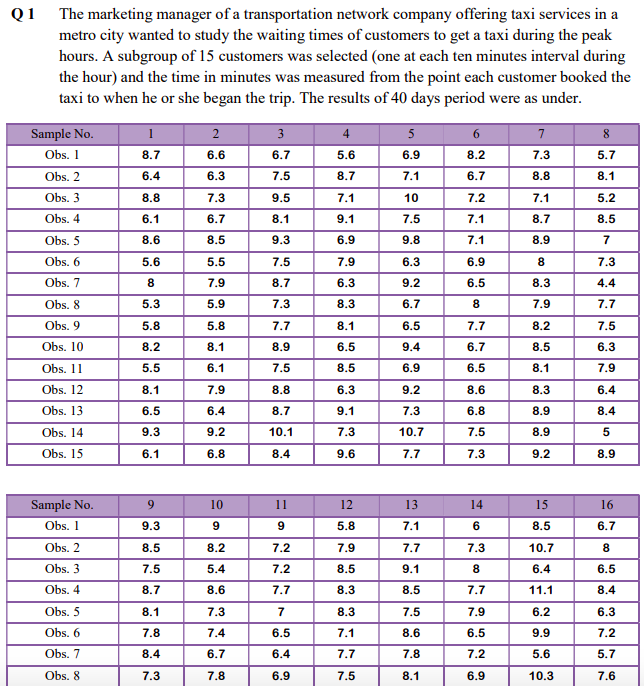

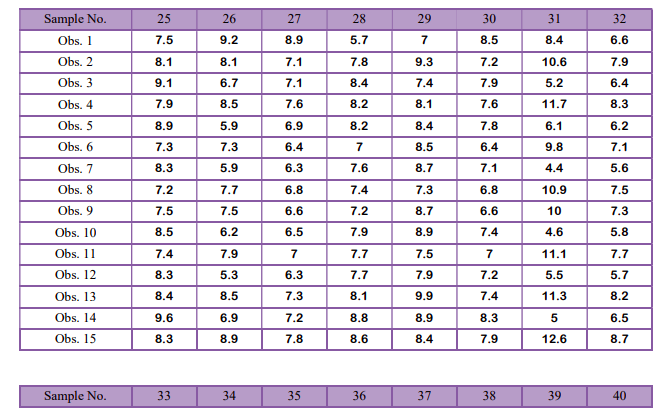

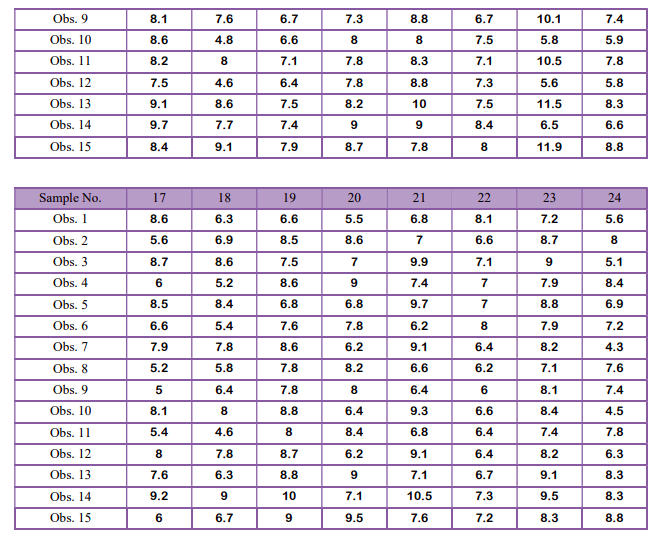
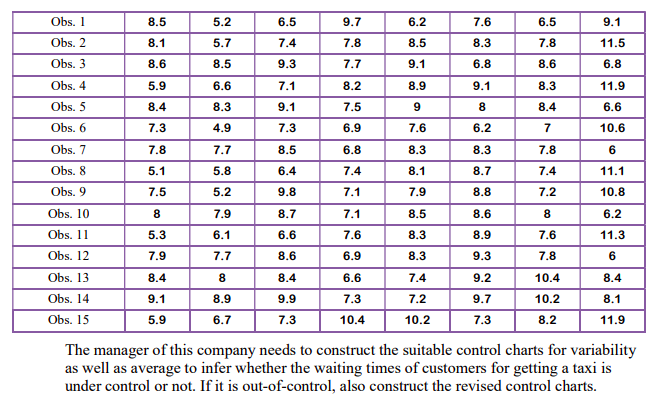
Q 1 The marketing manager of a transportation network company offering taxi services in a metro city wanted to study the waiting times of customers to get a taxi during the peak hours. A subgroup of 15 customers was selected (one at each ten minutes interval during the hour) and the time in minutes was measured from the point each customer booked the taxi to when he or she began the trip. The results of 40 days period were as under. Sample No. 2 3 4 5 6 7 8 Obs. 1 8.7 6.6 6.7 5.6 6.9 8.2 7.3 5.7 Obs. 2 6.4 6.3 7.5 8.7 7.1 8.7 B.8 8.1 Obs. 3 8.8 7.3 9.5 7.1 10 7.2 7.1 5.2 Obs. 4 6.1 6.7 8.1 3.1 7.5 7.1 8.7 8.5 Obs. 5 8.6 8.5 9.3 6.9 9.8 7.1 8.9 7 Obs. 6 5.6 5.5 7.5 7.9 6.3 6.9 8 7.3 Obs. 7 8 7.9 8.7 6.3 9.2 6.5 B.3 4.4 Obs. 8 5.3 5.9 7.3 8.3 6.7 8 7.9 7.7 Obs. 9 5.8 5.8 7.7 8.1 6.5 7.7 8.2 7.5 Obs. 10 8.2 8.1 8.9 6.5 9.4 6.7 8.5 6.3 Obs. 11 5.5 6.1 7.5 8.5 6.9 6.5 B.1 7.9 Obs. 12 8.1 7.9 3.8 6.3 9.2 8.6 8.3 6.4 Obs. 13 6.5 6.4 8.7 9.1 7.3 6.8 B.9 8.4 Obs. 14 9.3 9.2 10.1 7.3 10.7 7.5 8.9 5 Obs. 15 6.1 6.8 8.4 9.6 7.7 7.3 9.2 8.9 Sample No. 9 10 11 12 13 14 15 16 Obs. 1 9.3 9 9 5.8 7.1 6 8.5 6.7 Obs. 2 8.5 8.2 7.2 7.9 7.7 7.3 10.7 8 Obs. 3 7.5 5.4 7.2 3.5 9.1 8 3.4 6.5 Obs. 4 8.7 8.6 7.7 8.3 8.5 7.7 11.1 8.4 Obs. 5 8.1 7.3 7 8.3 7.5 7.9 6.2 6.3 Obs. 6 7.8 7.4 6.5 7.1 B.6 6.5 9.9 7.2 Obs. 7 8.4 6.7 6.4 7.7 7.8 7.2 5.6 5.7 Obs. 8 7.3 7.8 6.9 7.5 8.1 6.9 10.3 7.6Obs. 9 8.1 7.6 6.7 7.3 8.8 6.7 10.1 7.4 Obs. 10 8.6 4.8 6.6 8 8 7.5 5.8 5.9 Obs. 11 8.2 B 7.1 7.8 8.3 7.1 10.5 7.8 Obs. 12 7.5 4.6 6.4 7.8 8.8 7.3 5.6 5.8 Obs. 13 9.1 8.6 7.5 8.2 10 7.5 11.5 8.3 Obs. 14 9.7 7.7 7.4 9 9 8.4 6.5 6.6 Obs. 15 8.4 9.1 7.9 8.7 7.8 8 11.9 8.8 Sample No. 17 18 19 20 21 22 23 24 Obs. 1 8.6 6.3 6.6 5.5 6.8 8.1 7.2 5.6 Obs. 2 5.6 6.9 8.5 8.6 7 6.6 8.7 8 Obs. 3 8.7 8.6 7.5 7 9.9 7.1 9 5.1 Obs. 4 6 5.2 8.6 9 7.4 7 7.9 8.4 Obs. 5 8.5 8.4 6.8 6.8 9.7 7 8.8 6.9 Obs. 6 6.6 5.4 7.6 7.8 6.2 8 7.9 7.2 Obs. 7 7.9 7.8 8.6 6.2 9.1 6.4 B.2 4.3 Obs. 8 5.2 5.8 7.8 8.2 6.6 6.2 7.1 7.6 Obs. 9 5 6.4 7.8 8 6.4 6 8.1 7.4 Obs. 10 8.1 8 8.8 6.4 9.3 6.6 8.4 4.5 Obs. 11 5.4 4.6 8 8.4 6.8 6.4 7.4 7.8 Obs. 12 8 7.8 8.7 6.2 9.1 6.4 8.2 6.3 Obs. 13 7.6 6.3 8.8 9 7.1 6.7 9.1 B.3 Obs. 14 9.2 9 10 7.1 10.5 7.3 9.5 8.3 Obs. 15 6 6.7 9 9.5 7.6 7.2 8.3 8.8Sample No. 25 26 27 28 29 30 31 32 Obs. 1 7.5 9.2 8.9 5.7 7 8.5 8.4 6.6 Obs. 2 8.1 8.1 7.1 7.8 9.3 7.2 10.6 7.9 Obs. 3 9.1 6.7 7.1 8.4 7.4 7.9 5.2 6.4 Obs. 4 7.9 8.5 7.6 8.2 8.1 7.6 11.7 8.3 Obs. 5 8.9 5.9 6.9 8.2 8.4 7.8 6.1 6.2 Obs. 6 7.3 7.3 6.4 7 8.5 6.4 9.8 7.1 Obs. 7 8.3 5.9 6.3 7.6 8.7 7.1 4.4 5.6 Obs. 8 7.2 7.7 6.8 7.4 7.3 6.8 10.9 7.5 Obs. 9 7.5 7.5 6.6 7.2 8.7 6.6 10 7.3 Obs. 10 8.5 6.2 6.5 7.9 8.9 7.4 4.6 5.8 Obs. 11 7.4 7.9 7 7.7 7.5 7 11.1 7.7 Obs. 12 8.3 5.3 6.3 7.7 7.9 7.2 5.5 5.7 Obs. 13 8.4 8.5 7.3 8.1 9.9 7.4 11.3 8.2 Obs. 14 9.6 6.9 7.2 8.8 8.9 8.3 5 6.5 Obs. 15 8.3 8.9 7.8 8.6 8.4 7.9 12.6 8.7 Sample No. 33 34 35 36 37 38 39 40Obs. 1 8.5 5.2 6.5 9.7 6.2 7.6 6.5 9.1 Obs. 2 8.1 5.7 7.4 7.8 8.5 8.3 7.8 11.5 Obs. 3 8.6 8.5 9.3 7.7 9.1 6.8 8.6 6.8 Obs. 4 5.9 6.6 7.1 8.2 8.9 9.1 8.3 11.9 Obs. 5 8.4 8.3 9.1 7.5 9 8 8.4 6.6 Obs. 6 7.3 4.9 7.3 6.9 7.6 6.2 7 10.6 Obs. 7 7.8 7.7 8.5 6.8 8.3 8.3 7.8 6 Obs. 8 5.1 5.8 6.4 7.4 8.1 8.7 7.4 11.1 Obs. 9 7.5 5.2 9.8 7.1 7.9 8.8 7.2 10.8 Obs. 10 8 7.9 8.7 7.1 8.5 8.6 8 6.2 Obs. 11 5.3 6.1 6.6 7.6 8.3 8.9 7.6 11.3 Obs. 12 7.9 7.7 8.6 6.9 8.3 9.3 7.8 6 Obs. 13 8.4 8 8.4 6.6 7.4 9.2 10.4 8.4 Obs. 14 9.1 8.9 9.9 7.3 7.2 9.7 10.2 8.1 Obs. 15 5.9 6.7 7.3 10.4 10.2 7.3 8.2 11.9 The manager of this company needs to construct the suitable control charts for variability as well as average to infer whether the waiting times of customers for getting a taxi is under control or not. If it is out-of-control, also construct the revised control charts.Solve the following questions in MS Excel 2007. Take the screenshots of the final output/spreadsheet. Paste all screenshots in the assignments booklets with all necessary hypotheses, interpretation, etc
Step by Step Solution
There are 3 Steps involved in it

Get step-by-step solutions from verified subject matter experts