

Question: Please solve this question with detailed steps Question 1- The Laplace transform of the temporal response of a system to an impulse excitation is plotted
Please solve this question with detailed steps
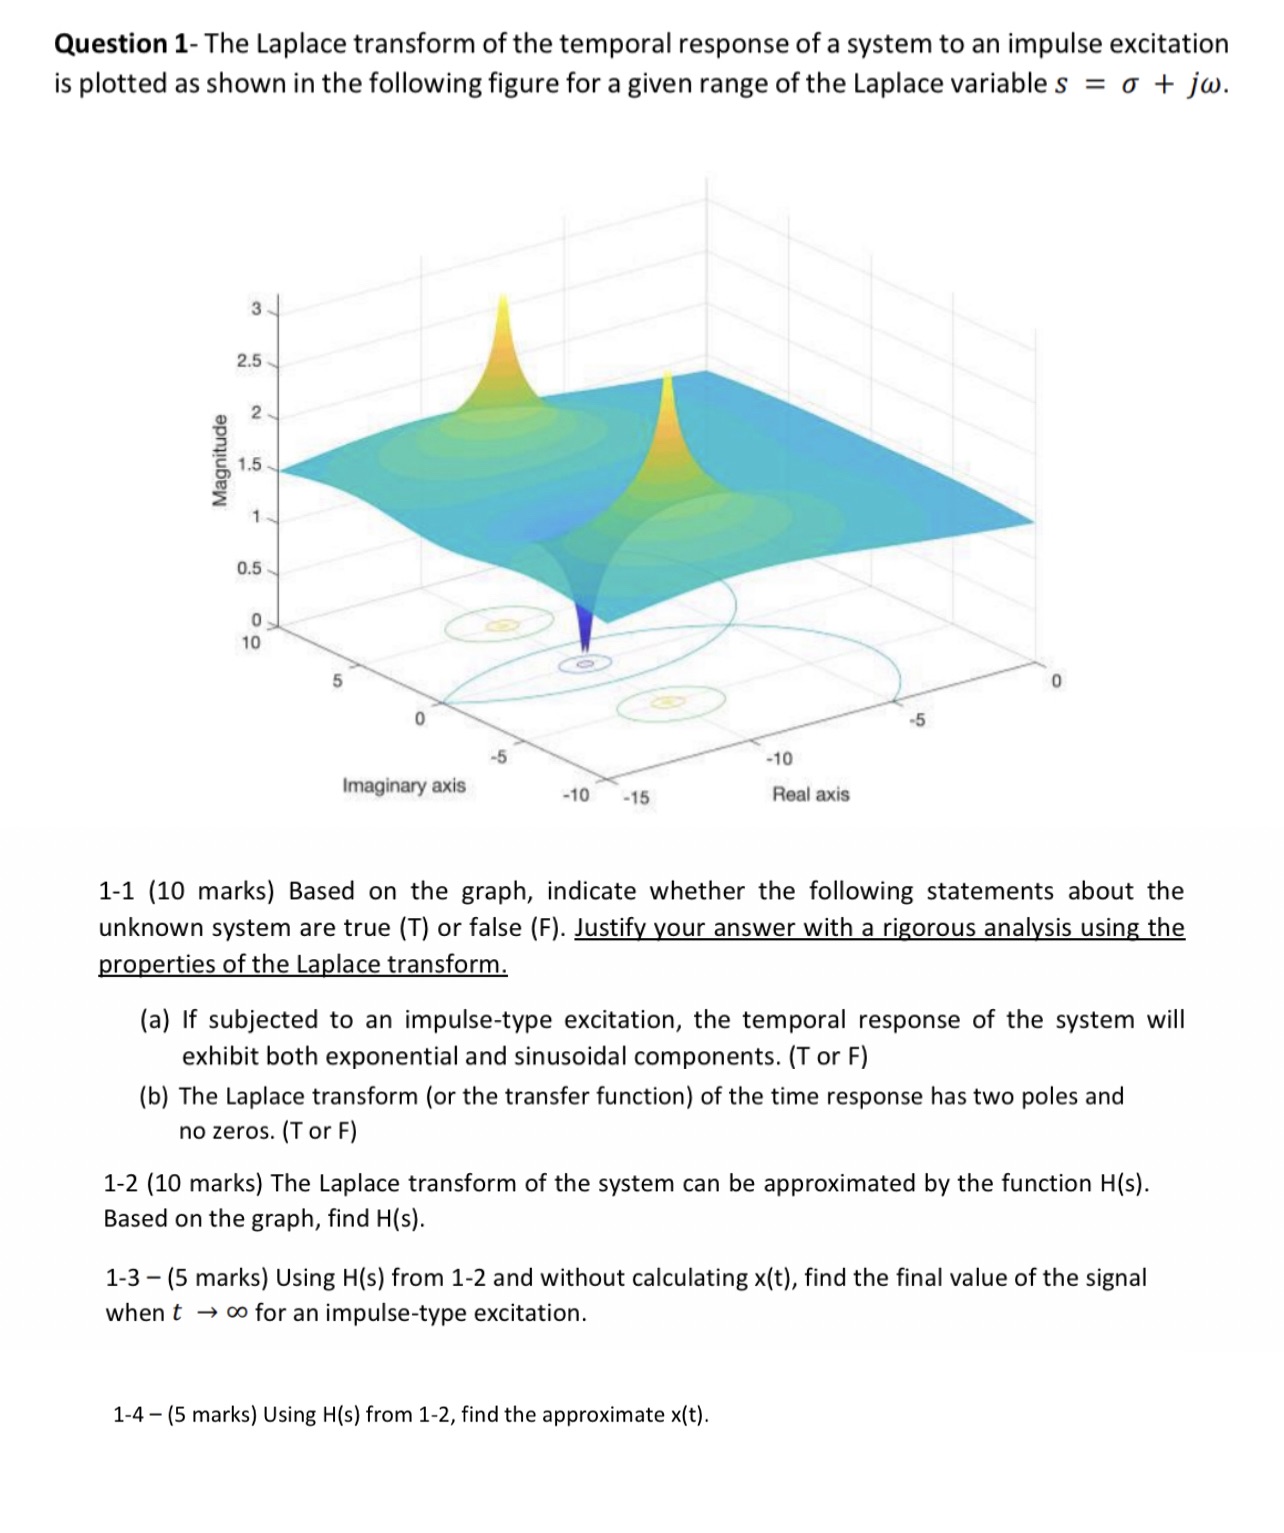
Question 1- The Laplace transform of the temporal response of a system to an impulse excitation is plotted as shown in the following figure for a given range of the Laplace variables = + jw. Magnitude 2.5 2 1.5 0.5 0 10 1 3 0 -10 Imaginary axis -10 -15 Real axis 1-1 (10 marks) Based on the graph, indicate whether the following statements about the unknown system are true (T) or false (F). Justify your answer with a rigorous analysis using the properties of the Laplace transform. (a) If subjected to an impulse-type excitation, the temporal response of the system will exhibit both exponential and sinusoidal components. (T or F) (b) The Laplace transform (or the transfer function) of the time response has two poles and no zeros. (T or F) 1-2 (10 marks) The Laplace transform of the system can be approximated by the function H(s). Based on the graph, find H(s). 1-3 (5 marks) Using H(s) from 1-2 and without calculating x(t), find the final value of the signal when too for an impulse-type excitation. 1-4-(5 marks) Using H(s) from 1-2, find the approximate x(t).
Step by Step Solution
There are 3 Steps involved in it

Get step-by-step solutions from verified subject matter experts